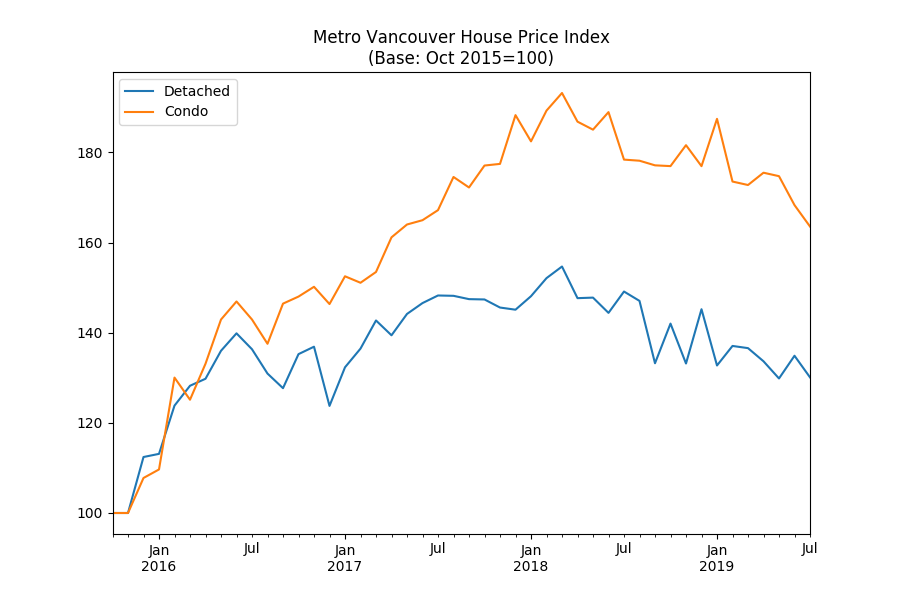
Metro Vancouver detached home prices have dropped by 13% year-over-year, according to the latest sales numbers reported in the region.
The Open House House Price Index is calculated using the generally-accepted and transparent repeat sales or Case-Shiller method1.
Looking at home sales reported in the last 30 days, 40 out 46 single family homes sold for below 2019 assessed value in the City of Vancouver, with the median sale being 12% below assessed.
An East Vancouver property assessed at $1.26 million and listed for $1.29 million ended up selling for just $900,000.
In Richmond, all but 4 properties sold in the last 30 days, sold below assessment, with a property in Broadmoor selling for 35% below assessed value, and the median sale being 16% below assessed.
In West Vancouver, all but one property sold below assessment, with a property in Altamont selling for 39% below assessed value, and the median sale being 14% below assessed.
In North Vancouver, all but one property sold below assessment with the median sale being 9% below assessed.
Open House House Price Index covers Vancouver, Richmond, Burnaby, West Vancouver, New Westminster, North Vancouver, Delta, Surrey, Port Moody, Port Coquitlam, Pitt Meadows, Maple Ridge, Lions Bay, Bower Island, Anmore, and Belcarra, Langley and White Rock. Data for Vancouver also include University British Columbia and University Endowment Lands.
Vancouver
| Address | Assessed | True List Price | True List Date | Year Built | Sold Price | Sold Date | % Change from Assessed | Sqft | Price per sqft |
|---|---|---|---|---|---|---|---|---|---|
| 4728 LITTLE STREET | $1,262,400 | $1,189,000 | 04-Apr-2019 | 1910 | $900,000 | 18-Jul-2019 | -28.71 | 1,700 | $529 |
| 4469 ANGUS DRIVE | $9,958,000 | $11,880,000 | 28-May-2018 | 2010 | $7,430,000 | 13-Jul-2019 | -25.39 | 5,531 | $1,343 |
| 6350 ALMA STREET | $2,661,000 | $2,678,000 | 20-Feb-2019 | 1971 | $2,010,000 | 13-Jul-2019 | -24.46 | 2,838 | $708 |
| 736 W 46TH AVENUE | $3,098,800 | $2,688,000 | 22-May-2019 | 1963 | $2,350,000 | 18-Jul-2019 | -24.16 | 1,682 | $1,397 |
| 2330 DUNDAS STREET | $1,544,000 | $1,534,000 | 01-Feb-2019 | 1949 | $1,200,000 | 11-Jul-2019 | -22.28 | 1,977 | $606 |
| 575 W 17TH AVENUE | $2,336,900 | $2,150,000 | 23-Apr-2019 | 1927 | $1,820,000 | 15-Jul-2019 | -22.12 | 2,392 | $760 |
| 3433 OXFORD STREET | $1,395,100 | $1,680,000 | 19-Jan-2018 | 1912 | $1,095,000 | 25-Jul-2019 | -21.51 | 2,315 | $473 |
| 1832 KNOX ROAD | $5,553,000 | $5,889,000 | 22-Jan-2019 | 1951 | $4,400,000 | 06-Jul-2019 | -20.76 | 3,274 | $1,343 |
| 6467 LARCH STREET | $3,991,000 | $4,368,000 | 21-Sep-2018 | 2008 | $3,180,000 | 13-Jul-2019 | -20.32 | 4,232 | $751 |
| 3959 W 36TH AVENUE | $4,116,100 | $4,000,000 | 22-May-2019 | 1939 | $3,280,000 | 07-Jul-2019 | -20.31 | 3,467 | $946 |
| 3463 E 4TH AVENUE | $1,866,000 | $1,598,800 | 01-May-2019 | 1993 | $1,500,000 | 05-Jul-2019 | -19.61 | 3,025 | $495 |
| 1656 NANTON AVENUE | $4,683,400 | $4,980,000 | 11-Apr-2019 | 1924 | $3,770,000 | 05-Jul-2019 | -19.50 | 4,250 | $887 |
| 3678 E 25TH AVENUE | $1,490,400 | $1,850,000 | 16-Jul-2018 | 1954 | $1,200,000 | 13-Jul-2019 | -19.48 | 2,098 | $571 |
| 3281 E 7TH AVENUE | $1,320,900 | $1,428,890 | 03-Apr-2018 | 1942 | $1,080,000 | 16-Jul-2019 | -18.24 | 1,712 | $630 |
| 1292 W 40TH AVENUE | $4,615,000 | $5,680,000 | 04-Jun-2018 | 1998 | $3,780,000 | 09-Jul-2019 | -18.09 | 4,713 | $802 |
| 2880 LAKEWOOD DRIVE | $1,399,700 | $1,480,000 | 20-Sep-2018 | 1928 | $1,150,000 | 04-Jul-2019 | -17.84 | 1,950 | $589 |
| 3335 W 39TH AVENUE | $2,796,600 | $2,688,000 | 08-May-2019 | 1941 | $2,300,000 | 16-Jul-2019 | -17.76 | 3,016 | $762 |
| 3336 W 37TH AVENUE | $2,829,000 | $2,799,000 | 04-Feb-2019 | 1922 | $2,368,000 | 04-Jul-2019 | -16.30 | 2,807 | $843 |
| 165 E 55TH AVENUE | $1,617,900 | $1,780,000 | 05-Aug-2017 | 1952 | $1,370,000 | 17-Jul-2019 | -15.32 | 1,950 | $702 |
| 4084 W 14TH AVENUE | $2,686,000 | $2,560,000 | 01-Apr-2019 | 1926 | $2,320,000 | 04-Jul-2019 | -13.63 | 2,404 | $965 |
| 605 E 48TH AVENUE | $1,525,000 | $1,628,000 | 14-Jan-2019 | 1910 | $1,320,000 | 15-Jul-2019 | -13.44 | 3,316 | $398 |
| 1404 PARKER STREET | $1,538,000 | $1,650,000 | 17-Sep-2018 | 1905 | $1,350,000 | 05-Jul-2019 | -12.22 | 2,324 | $580 |
| 2450 OLIVER CRESCENT | $3,177,800 | $3,288,000 | 16-Jan-2019 | 1951 | $2,800,000 | 10-Jul-2019 | -11.89 | 2,282 | $1,226 |
| 7848 MAIN STREET | $1,552,000 | $1,749,800 | 23-Oct-2018 | 1953 | $1,375,000 | 05-Jul-2019 | -11.40 | 3,600 | $381 |
| 1764 W 57TH AVENUE | $2,301,000 | $2,588,000 | 02-May-2019 | 1931 | $2,050,000 | 02-Jul-2019 | -10.91 | 3,298 | $621 |
| 1878 STAINSBURY AVENUE | $1,054,200 | $1,249,000 | 05-Aug-2016 | 1912 | $940,000 | 09-Jul-2019 | -10.83 | 2,066 | $454 |
| 4586 W 8TH AVENUE | $2,447,000 | $1,970,000 | 15-Oct-2015 | 1987 | $2,200,000 | 13-Jul-2019 | -10.09 | 2,253 | $976 |
| 2715 W 20TH AVENUE | $3,527,000 | $3,780,000 | 27-May-2019 | 2009 | $3,200,000 | 03-Jul-2019 | -9.27 | 3,380 | $946 |
| 6583 KNIGHT STREET | $1,707,000 | $799,900 | 09-Oct-2015 | 2017 | $1,549,900 | 19-Jul-2019 | -9.20 | 2,789 | $555 |
| 1570 W 64TH AVENUE | $2,161,000 | $2,779,000 | 25-Jul-2017 | 1920 | $1,984,000 | 07-Jul-2019 | -8.19 | 2,828 | $701 |
| 3202 E 62ND AVENUE | $1,773,000 | $1,988,000 | 18-Jun-2018 | 1973 | $1,650,000 | 03-Jul-2019 | -6.94 | 3,262 | $505 |
| 3920 W 17TH AVENUE | $3,437,000 | $3,888,000 | 05-Nov-2018 | 2017 | $3,238,000 | 02-Jul-2019 | -5.79 | 3,027 | $1,069 |
| 5874 BATTISON STREET | $2,433,000 | $2,650,000 | 19-Dec-2015 | 2017 | $2,300,000 | 04-Jul-2019 | -5.47 | 3,878 | $593 |
| 2860 LAKEWOOD DRIVE | $1,211,500 | $1,480,000 | 20-Sep-2018 | 1928 | $1,150,000 | 04-Jul-2019 | -5.08 | 1,950 | $589 |
| 3612 ETON STREET | $1,361,300 | $1,788,000 | 25-Sep-2017 | 1975 | $1,295,000 | 09-Jul-2019 | -4.87 | 2,163 | $598 |
| 5023 SHERBROOKE STREET | $1,247,700 | $1,269,000 | 24-Jul-2018 | 1946 | $1,190,000 | 14-Jul-2019 | -4.62 | 945 | $1,259 |
| 3569 ANZIO DRIVE | $1,880,000 | $2,388,000 | 02-May-2017 | 1989 | $1,820,000 | 08-Jul-2019 | -3.19 | 3,979 | $457 |
| 8571 WILTSHIRE STREET | $2,166,400 | $2,180,000 | 13-Jan-2016 | 1956 | $2,100,000 | 10-Jul-2019 | -3.06 | 2,450 | $857 |
| 1816 W 14TH AVENUE | $3,889,000 | $4,288,000 | 15-May-2019 | 1912 | $3,800,000 | 10-Jul-2019 | -2.29 | 4,034 | $941 |
| 3668 W 3RD AVENUE | $2,987,000 | $3,388,890 | 22-Apr-2019 | 1911 | $2,980,000 | 16-Jul-2019 | -0.23 | 3,435 | $867 |
| 3435 W 28TH AVENUE | $3,243,000 | $3,580,000 | 29-Apr-2019 | 2016 | $3,250,000 | 09-Jul-2019 | 0.22 | 3,067 | $1,059 |
| 2015 W 53RD AVENUE | $4,613,000 | $5,580,000 | 14-May-2018 | 2015 | $4,680,000 | 05-Jul-2019 | 1.45 | 4,329 | $1,081 |
| 120 E 41ST AVENUE | $1,277,100 | $1,997,000 | 26-Feb-2019 | 1961 | $1,313,000 | 02-Jul-2019 | 2.81 | 2,230 | $588 |
| 2645 TRIUMPH STREET | $1,323,200 | $1,388,000 | 30-Aug-2016 | 1922 | $1,385,000 | 16-Jul-2019 | 4.67 | 2,602 | $532 |
| 1706 W 66TH AVENUE | $4,356,000 | $2,380,000 | 25-Sep-2015 | 2017 | $5,500,000 | 15-Jul-2019 | 26.26 | 5,212 | $1,055 |
| 3620 CAROLINA STREET | $1,044,000 | $988,000 | 29-Sep-2015 | 1970 | $1,478,000 | 14-Jul-2019 | 41.57 | 1,528 | $967 |
Richmond
| Address | Assessed | True List Price | True List Date | Year Built | Sold Price | Sold Date | % Change from Assessed | Sqft | Price per sqft |
|---|---|---|---|---|---|---|---|---|---|
| 7211 WILLIAMS ROAD | $1,890,000 | $1,888,000 | 15-Feb-2019 | 1990 | $1,220,000 | 07-Jul-2019 | -35.45 | 4,534 | $269 |
| 10571 AINTREE CRESCENT | $1,682,400 | $1,550,000 | 06-May-2019 | 1959 | $1,200,000 | 04-Jul-2019 | -28.67 | 2,220 | $540 |
| 7260 GILHURST CRESCENT | $1,851,900 | $1,988,000 | 15-Jan-2019 | 1959 | $1,398,000 | 09-Jul-2019 | -24.51 | 1,800 | $776 |
| 11740 TRUMPETER DRIVE | $1,372,500 | $1,400,000 | 15-Oct-2018 | 1973 | $1,047,500 | 02-Jul-2019 | -23.68 | 1,402 | $747 |
| 8311 ROSEBANK CRESCENT | $1,528,600 | $1,488,000 | 22-Feb-2019 | 1968 | $1,182,500 | 14-Jul-2019 | -22.64 | 2,544 | $464 |
| 10726 CANSO CRESCENT | $1,293,500 | $1,288,000 | 24-Sep-2018 | 1980 | $1,020,000 | 04-Jul-2019 | -21.14 | 1,358 | $751 |
| 5200 TURQUOISE DRIVE | $1,532,500 | $1,328,000 | 21-Mar-2019 | 1980 | $1,218,000 | 03-Jul-2019 | -20.52 | 2,497 | $487 |
| 8671 ELSMORE ROAD | $1,563,500 | $1,688,000 | 02-Jun-2018 | 1959 | $1,250,000 | 18-Jul-2019 | -20.05 | 2,086 | $599 |
| 9851 GILHURST CRESCENT | $2,867,000 | $3,518,800 | 11-Jan-2017 | 2011 | $2,300,000 | 08-Jul-2019 | -19.78 | 3,886 | $591 |
| 7700 SUNNYHOLME CRESCENT | $2,829,000 | $3,388,000 | 23-May-2017 | 1994 | $2,300,000 | 11-Jul-2019 | -18.70 | 3,830 | $600 |
| 5171 LANCING ROAD | $2,264,000 | $2,190,000 | 25-Apr-2019 | 1993 | $1,845,000 | 11-Jul-2019 | -18.51 | 4,320 | $427 |
| 9651 SNOWDON AVENUE | $1,446,000 | $1,298,000 | 22-May-2019 | 1973 | $1,208,000 | 13-Jul-2019 | -16.46 | 2,295 | $526 |
| 10371 2ND AVENUE | $1,684,600 | $2,000,000 | 15-Sep-2018 | 1973 | $1,437,000 | 18-Jul-2019 | -14.70 | 1,928 | $745 |
| 3151 RICHMOND STREET | $1,666,000 | $1,988,000 | 30-Apr-2018 | 2007 | $1,465,000 | 09-Jul-2019 | -12.06 | 2,583 | $567 |
| 5711 ROWLING PLACE | $1,018,000 | $968,000 | 13-Aug-2018 | 1994 | $905,000 | 08-Jul-2019 | -11.10 | 2,006 | $451 |
| 9680 GILBERT ROAD | $1,624,900 | $1,668,000 | 14-May-2019 | 1963 | $1,460,000 | 15-Jul-2019 | -10.15 | 1,917 | $761 |
| 3388 NEWMORE AVENUE | $2,296,000 | $1,988,000 | 05-Apr-2019 | 2011 | $2,150,000 | 10-Jul-2019 | -6.36 | 3,315 | $648 |
| 5166 SAPPHIRE PLACE | $1,418,600 | $1,598,800 | 21-Mar-2019 | 1979 | $1,375,000 | 07-Jul-2019 | -3.07 | 2,439 | $563 |
| 11128 MERCHANTMAN PLACE | $1,672,000 | $2,156,000 | 17-Jan-2019 | 2017 | $1,650,000 | 02-Jul-2019 | -1.32 | 2,551 | $646 |
| 10611 SKAGIT DRIVE | $2,286,000 | $2,998,800 | 06-Jun-2016 | 2014 | $2,288,000 | 13-Jul-2019 | 0.09 | 3,262 | $701 |
| 9280 WALFORD STREET | $1,128,900 | $1,220,000 | 08-Mar-2018 | 1981 | $1,130,000 | 08-Jul-2019 | 0.10 | 2,481 | $455 |
| 7751 SUNNYHOLME CRESCENT | $3,723,000 | $5,880,000 | 08-May-2018 | 2012 | $4,018,800 | 02-Jul-2019 | 7.95 | 4,700 | $855 |
| 3360 FRANCIS ROAD | $2,148,000 | $1,589,000 | 31-May-2017 | 2017 | $2,504,760 | 05-Jul-2019 | 16.61 | 3,960 | $632 |
Burnaby
| Address | Assessed | True List Price | True List Date | Year Built | Sold Price | Sold Date | % Change from Assessed | Sqft | Price per sqft |
|---|---|---|---|---|---|---|---|---|---|
| 7158 HASTINGS STREET | $2,035,000 | $2,499,000 | 20-Sep-2018 | 2018 | $1,856,500 | 02-Jul-2019 | -8.77 | 3,603 | $515 |
| 4264 FITZGERALD AVENUE | $1,533,000 | $1,598,000 | 14-Mar-2019 | 1977 | $1,475,000 | 03-Jul-2019 | -3.78 | 3,201 | $460 |
| 4635 BOND STREET | $1,643,100 | $1,749,000 | 21-Aug-2018 | 1956 | $1,500,000 | 04-Jul-2019 | -8.71 | 2,312 | $648 |
| 4430 WILLIAM STREET | $1,927,000 | $2,499,000 | 29-Nov-2017 | 1993 | $1,928,000 | 06-Jul-2019 | 0.05 | 4,382 | $439 |
| 3940 FIR STREET | $1,711,600 | $1,799,000 | 07-May-2019 | 1971 | $1,565,000 | 06-Jul-2019 | -8.57 | 2,648 | $591 |
| 108 N GLYNDE AVENUE | $1,942,000 | $2,398,800 | 27-Sep-2016 | 2015 | $1,660,000 | 06-Jul-2019 | -14.52 | 2,383 | $696 |
| 4247 ETON STREET | $1,288,000 | $1,399,000 | 18-Mar-2019 | 1914 | $1,300,000 | 08-Jul-2019 | 0.93 | 1,712 | $759 |
| 1338 GLEN ABBEY DRIVE | $1,305,000 | $1,299,000 | 27-Jul-2016 | 1980 | $1,500,000 | 09-Jul-2019 | 14.94 | 3,747 | $400 |
| 6312 PEARL AVENUE | $2,475,000 | $2,980,000 | 25-Mar-2019 | 2000 | $2,400,000 | 10-Jul-2019 | -3.03 | 4,613 | $520 |
| 3759 PORTLAND STREET | $1,449,300 | $1,598,000 | 03-Apr-2018 | 2018 | $2,600,000 | 10-Jul-2019 | 79.40 | 4,751 | $547 |
| 9152 KLENNER DRIVE | $1,333,000 | $1,599,800 | 16-Oct-2018 | 1969 | $1,181,000 | 10-Jul-2019 | -11.40 | 3,307 | $357 |
| 1081 FELL AVENUE | $1,681,500 | $1,439,000 | 09-May-2019 | 1967 | $1,300,000 | 11-Jul-2019 | -22.69 | 2,369 | $548 |
| 8236 WEDGEWOOD STREET | $1,384,000 | $1,499,000 | 31-Jan-2019 | 1955 | $1,200,000 | 13-Jul-2019 | -13.29 | 2,334 | $514 |
| 1360 SPRINGER AVENUE | $1,471,000 | $2,598,000 | 06-Feb-2019 | 2018 | $2,285,710 | 14-Jul-2019 | 55.38 | 4,244 | $538 |
| 6228 6TH STREET | $1,537,000 | $2,388,000 | 08-Aug-2016 | 1978 | $1,638,000 | 16-Jul-2019 | 6.57 | 4,300 | $380 |
| 7055 RIDGE DRIVE | $2,374,000 | $1,298,000 | 04-Apr-2016 | 2017 | $1,961,900 | 23-Jul-2019 | -17.36 | 3,698 | $530 |
West Vancouver
| Address | Assessed | True List Price | True List Date | Year Built | Sold Price | Sold Date | % Change from Assessed | Sqft | Price per sqft |
|---|---|---|---|---|---|---|---|---|---|
| 2935 ALTAMONT PLACE | $2,525,500 | $2,350,000 | 08-Apr-2019 | 1958 | $1,540,000 | 09-Jul-2019 | -39.02 | 2,199 | $700 |
| 3165 MATHERS AVENUE | $2,668,400 | $2,490,000 | 03-Dec-2018 | 1951 | $1,890,000 | 13-Jul-2019 | -29.17 | 1,390 | $1,359 |
| 765 SOUTHBOROUGH DRIVE | $2,119,200 | $3,700,000 | 05-Apr-2018 | 1956 | $1,550,000 | 10-Jul-2019 | -26.86 | 3,304 | $469 |
| 2121 JEFFERSON AVENUE | $2,604,200 | $2,479,000 | 15-Mar-2019 | 1944 | $2,050,000 | 02-Jul-2019 | -21.28 | 3,029 | $676 |
| 2909 MATHERS AVENUE | $3,901,700 | $6,588,800 | 18-Nov-2016 | 1937 | $3,350,000 | 15-Jul-2019 | -14.14 | 3,500 | $957 |
| 6002 GLENEAGLES PLACE | $2,632,000 | $3,538,000 | 07-Mar-2016 | 1997 | $2,300,000 | 08-Jul-2019 | -12.61 | 5,103 | $450 |
| 432 GORDON AVENUE | $2,652,000 | $2,880,000 | 06-May-2019 | 1997 | $2,445,000 | 06-Jul-2019 | -7.81 | 4,515 | $541 |
| 2349 LAWSON AVENUE | $2,473,000 | $3,688,000 | 07-Jun-2017 | 1990 | $2,290,000 | 08-Jul-2019 | -7.40 | 3,393 | $674 |
| 6454 WELLINGTON AVENUE | $1,619,000 | $1,768,000 | 03-Feb-2019 | 1997 | $1,660,000 | 04-Jul-2019 | 2.53 | 3,263 | $508 |
North Vancouver
| Address | Assessed | True List Price | True List Date | Year Built | Sold Price | Sold Date | % Change from Assessed | Sqft | Price per sqft |
|---|---|---|---|---|---|---|---|---|---|
| 1804 FELL AVENUE | $1,340,600 | $1,100,000 | 12-Feb-2016 | 1951 | $1,030,000 | 09-Jul-2019 | -23.17 | 1,442 | $714 |
| 298 MONTERAY AVENUE | $1,579,300 | $2,938,900 | 26-Sep-2018 | 2017 | $1,219,050 | 17-Jul-2019 | -22.81 | 4,420 | $275 |
| 212 W 6TH STREET | $2,354,000 | $2,588,000 | 13-Mar-2018 | 2018 | $1,825,000 | 11-Jul-2019 | -22.47 | 3,562 | $512 |
| 290 MONTERAY AVENUE | $1,551,200 | $2,898,900 | 26-Sep-2018 | 2017 | $1,219,050 | 17-Jul-2019 | -21.41 | 4,260 | $286 |
| 953 E 13TH STREET | $1,471,900 | $1,429,000 | 08-May-2019 | 1956 | $1,218,000 | 07-Jul-2019 | -17.25 | 2,158 | $564 |
| 337 W 20TH STREET | $2,623,000 | $2,780,000 | 25-Sep-2018 | 2015 | $2,300,000 | 05-Jul-2019 | -12.31 | 4,694 | $489 |
| 121 E ST. JAMES ROAD | $1,712,000 | $1,695,000 | 02-May-2019 | 2000 | $1,530,000 | 04-Jul-2019 | -10.63 | 3,055 | $500 |
| 1326 COTTONWOOD CRESCENT | $1,199,200 | $1,299,000 | 21-Aug-2017 | 1951 | $1,092,000 | 16-Jul-2019 | -8.94 | 1,309 | $834 |
| 296 NEWDALE COURT | $2,389,000 | $2,495,000 | 06-May-2019 | 1964 | $2,200,000 | 09-Jul-2019 | -7.91 | 3,645 | $603 |
| 1366 MILL STREET | $1,513,000 | $1,638,000 | 11-Sep-2018 | 1972 | $1,400,000 | 12-Jul-2019 | -7.47 | 2,896 | $483 |
| 3636 MAGINNIS AVENUE | $1,555,000 | $1,488,800 | 21-May-2019 | 1996 | $1,440,000 | 11-Jul-2019 | -7.40 | 2,775 | $518 |
| 176 W KINGS ROAD | $1,289,500 | $1,298,000 | 06-Feb-2019 | 1937 | $1,210,000 | 14-Jul-2019 | -6.17 | 1,772 | $682 |
| 832 PROSPECT AVENUE | $1,786,000 | $1,899,000 | 27-May-2019 | 1962 | $1,750,000 | 15-Jul-2019 | -2.02 | 2,710 | $645 |
| 2446 HYANNIS DRIVE | $1,391,000 | $1,399,000 | 24-May-2016 | 1969 | $1,375,000 | 11-Jul-2019 | -1.15 | 2,176 | $631 |
| 2460 CARNATION STREET | $2,327,000 | $1,400,000 | 04-Mar-2016 | 2017 | $2,433,330 | 11-Jul-2019 | 4.57 | 5,248 | $463 |
While these sales prices are a refreshing change of pace.
I don’t think the panic selling will truly set in until the short term flippers and specc’ers realize to their horror that they must sell their houses or condos due to mortgage renewals that they will either not qualify for under the new “stress test” rules OR they cant afford the payments as they stand now..
Either way . My heart pumps purple pee….
The next 12 months could truly be epic as thousands of real estate idiots realize that “Uppa Uppa Uppa” doesnt last forever.
One can only hope that many greedy realtors get burned as well…. either through their own greed as short term speculative home owners or evaporating sales commissions.
Happy Happy Housing CRASH to everyone sitting on the sidelines….. :)-