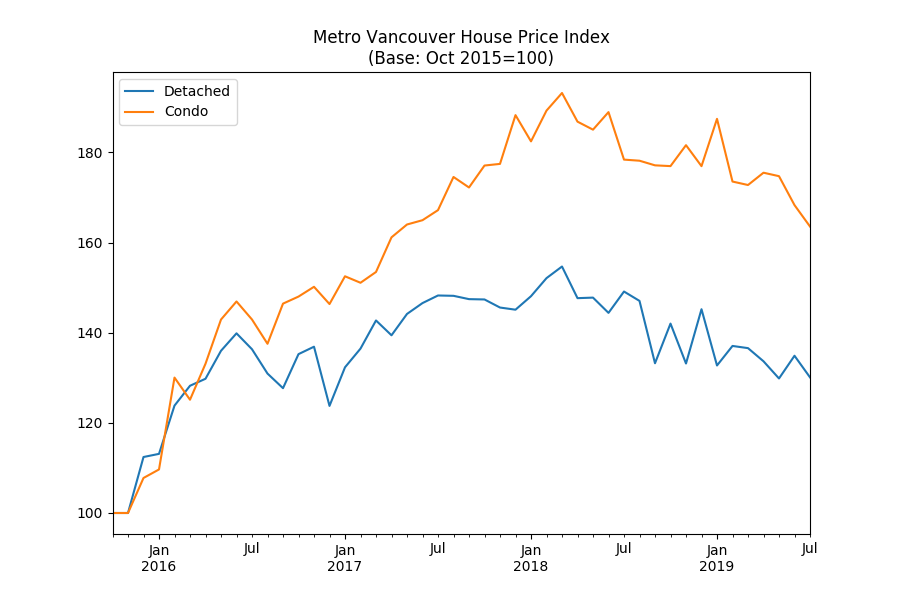
Metro Vancouver condo prices have dropped by 18% from the March 2018 peak with some units selling 32% below assessment.
The Open House House Price Index for condos – calculated using the generally-accepted and transparent repeat sales or Case-Shiller method1 – fell 8% year-over-year as in July.
Looking at home sales reported in the last 30 days, with nearly 9 out of 10 condos sold for below 2019 assessed value in the City of Vancouver, with the median condo selling for 9% below assessment.
A unit at Yacht Harbour Pointe in Yaletown sold for 32% below assessment, while another at Kerisdale’s St Moritz sold for 30% below assessed.
The per-square-foot prices of condos within City of Vancouver ranged from $445 at Champlain Ridge (leasehold) to $2,474 at Trump Tower.
Condo prices in other major Metro Vancouver municipalities have all shown similar declines.
Vancouver
| Address | Assessed | True List Price | True List Date | Year Built | Sold Price | Sold Date | % Change from Assessed | Sqft | Price per sqft |
|---|---|---|---|---|---|---|---|---|---|
| 303 1600 HORNBY STREET | $3,048,000 | $2,388,000 | 13-Oct-2015 | 1995 | $2,070,000 | 05-Jul-2019 | -32.09 | 1,774 | $1,166 |
| 902 2350 W 39TH AVENUE | $1,202,000 | $1,188,000 | 22-Apr-2018 | 1987 | $845,000 | 08-Jul-2019 | -29.70 | 1,009 | $837 |
| 207 255 E 14TH AVENUE | $607,300 | $598,000 | 28-Jan-2019 | 1973 | $490,000 | 08-Jul-2019 | -19.32 | 641 | $764 |
| 1509 188 KEEFER STREET | $937,000 | $935,000 | 08-Dec-2017 | 2016 | $760,000 | 15-Jul-2019 | -18.89 | 850 | $894 |
| 214 336 E 1ST AVENUE | $674,000 | $699,000 | 06-May-2019 | 1994 | $550,000 | 16-Jul-2019 | -18.40 | 927 | $593 |
| 704 538 SMITHE STREET | $745,000 | $729,000 | 11-Mar-2019 | 2007 | $610,000 | 09-Jul-2019 | -18.12 | 646 | $944 |
| 3003 1500 HORNBY STREET | $2,108,000 | $1,998,000 | 24-Apr-2019 | 1993 | $1,750,000 | 03-Jul-2019 | -16.98 | 1,390 | $1,258 |
| 2905 501 PACIFIC STREET | $1,139,000 | $1,060,000 | 26-Mar-2019 | 1999 | $950,000 | 11-Jul-2019 | -16.59 | 970 | $979 |
| 1107 3455 ASCOT PLACE | $472,000 | $458,000 | 15-Oct-2018 | 1994 | $396,000 | 15-Jul-2019 | -16.10 | 646 | $613 |
| 2007 1367 ALBERNI STREET | $927,000 | $949,000 | 23-Jan-2019 | 1999 | $778,000 | 05-Jul-2019 | -16.07 | 830 | $937 |
| 1409 1708 COLUMBIA STREET | $929,000 | $849,900 | 28-Mar-2019 | 2013 | $780,000 | 15-Jul-2019 | -16.04 | 708 | $1,101 |
| 308 429 W 2ND AVENUE | $828,000 | $798,000 | 25-Apr-2019 | 2012 | $700,000 | 06-Jul-2019 | -15.46 | 692 | $1,011 |
| 2507 8131 NUNAVUT LANE | $965,000 | $988,000 | 28-Mar-2019 | 2016 | $820,000 | 22-Jul-2019 | -15.03 | 769 | $1,066 |
| 307 4818 ELDORADO MEWS | $768,000 | $725,000 | 29-Apr-2019 | 2013 | $655,000 | 09-Jul-2019 | -14.71 | 906 | $722 |
| 312 77 WALTER HARDWICK AVENUE | $1,101,000 | $999,900 | 17-Apr-2017 | 2009 | $940,000 | 14-Jul-2019 | -14.62 | 949 | $990 |
| 501 3168 RIVERWALK AVENUE | $690,000 | $624,900 | 19-Mar-2019 | 2015 | $590,000 | 09-Jul-2019 | -14.49 | 804 | $733 |
| 410 315 RENFREW STREET | $515,000 | $478,000 | 26-Mar-2019 | 1992 | $441,500 | 09-Jul-2019 | -14.27 | 738 | $598 |
| 209 2635 PRINCE EDWARD STREET | $846,000 | $845,000 | 08-Apr-2019 | 2005 | $732,000 | 07-Jul-2019 | -13.48 | 845 | $866 |
| 2603 1372 SEYMOUR STREET | $866,000 | $849,900 | 04-Apr-2019 | 2013 | $750,000 | 07-Jul-2019 | -13.39 | 645 | $1,162 |
| 1751 38 SMITHE STREET | $1,107,000 | $998,000 | 10-Apr-2017 | 2016 | $962,000 | 08-Jul-2019 | -13.10 | 806 | $1,193 |
| 5188 CHAMBERS STREET | $676,000 | $649,000 | 12-Jul-2018 | 2017 | $587,500 | 03-Jul-2019 | -13.09 | 870 | $675 |
| 1101 1633 ONTARIO STREET | $5,977,000 | $5,980,000 | 19-Jul-2018 | 2009 | $5,200,000 | 13-Jul-2019 | -13.00 | 2,830 | $1,837 |
| 3109 777 RICHARDS STREET | $1,493,000 | $1,429,000 | 20-Mar-2019 | 2016 | $1,300,000 | 06-Jul-2019 | -12.93 | 1,055 | $1,232 |
| 1107 1323 HOMER STREET | $688,000 | $530,000 | 02-Oct-2015 | 1993 | $600,000 | 07-Jul-2019 | -12.79 | 745 | $805 |
| 909 777 RICHARDS STREET | $1,371,000 | $1,398,000 | 16-Apr-2019 | 2016 | $1,200,000 | 11-Jul-2019 | -12.47 | 1,137 | $1,055 |
| 501 5555 YEW STREET | $953,000 | $1,090,000 | 25-Feb-2019 | 1977 | $835,000 | 12-Jul-2019 | -12.38 | 1,239 | $673 |
| 211 3133 RIVERWALK AVENUE | $688,000 | $679,000 | 06-May-2019 | 2013 | $605,000 | 14-Jul-2019 | -12.06 | 868 | $697 |
| 304 650 MOBERLY ROAD | $982,000 | $688,000 | 28-Apr-2016 | 1986 | $865,000 | 04-Jul-2019 | -11.91 | 901 | $960 |
| 1205 1060 ALBERNI STREET | $800,000 | $828,000 | 14-Jan-2019 | 1988 | $710,000 | 17-Jul-2019 | -11.25 | 831 | $854 |
| 201 5115 CAMBIE STREET | $1,132,000 | $1,160,000 | 14-Mar-2019 | 2017 | $1,005,000 | 06-Jul-2019 | -11.22 | 892 | $1,126 |
| 1506 1212 HOWE STREET | $650,000 | $628,000 | 08-Apr-2019 | 2008 | $577,500 | 10-Jul-2019 | -11.15 | 556 | $1,038 |
| 1008 108 W 1ST AVENUE | $775,000 | $599,000 | 24-Jun-2016 | 2013 | $690,000 | 11-Jul-2019 | -10.97 | 596 | $1,157 |
| 1006 933 E HASTINGS STREET | $544,000 | $525,000 | 08-May-2019 | 2018 | $485,000 | 09-Jul-2019 | -10.85 | 553 | $877 |
| 6702 1151 W GEORGIA STREET | $3,305,000 | $3,389,000 | 02-May-2019 | 2016 | $2,950,000 | 12-Jul-2019 | -10.74 | 1,192 | $2,474 |
| 302 2108 W 38TH AVENUE | $945,000 | $898,000 | 07-May-2019 | 1992 | $848,000 | 17-Jul-2019 | -10.26 | 1,235 | $686 |
| 2801 1050 BURRARD STREET | $1,165,000 | $1,250,000 | 14-Jan-2019 | 1994 | $1,050,000 | 14-Jul-2019 | -9.87 | 1,158 | $906 |
| 1608 668 CITADEL PARADE | $848,000 | $899,000 | 08-Dec-2018 | 2007 | $765,000 | 04-Jul-2019 | -9.79 | 800 | $956 |
| 305 5955 IONA DRIVE | $1,784,000 | $1,988,000 | 28-Aug-2018 | 2007 | $1,610,000 | 04-Jul-2019 | -9.75 | 1,468 | $1,096 |
| 702 5639 HAMPTON PLACE | $911,000 | $964,900 | 25-Mar-2019 | 2000 | $825,000 | 06-Jul-2019 | -9.44 | 1,108 | $744 |
| 205 2677 E BROADWAY | $680,000 | $490,000 | 21-Mar-2017 | 1996 | $616,000 | 13-Jul-2019 | -9.41 | 1,126 | $547 |
| 3205 1408 STRATHMORE MEWS | $800,000 | $748,000 | 23-Apr-2019 | 2002 | $725,000 | 04-Jul-2019 | -9.38 | 586 | $1,237 |
| 110 2277 E 30TH AVENUE | $378,100 | $415,000 | 03-Apr-2018 | 1977 | $343,000 | 18-Jul-2019 | -9.28 | 671 | $511 |
| 704 2288 PINE STREET | $1,047,000 | $1,088,000 | 02-Nov-2018 | 1991 | $950,000 | 17-Jul-2019 | -9.26 | 1,128 | $842 |
| 2505 930 CAMBIE STREET | $756,000 | $839,000 | 28-Jan-2019 | 1994 | $690,000 | 03-Jul-2019 | -8.73 | 820 | $841 |
| 301 983 E HASTINGS STREET | $657,000 | $699,000 | 08-Mar-2019 | 2018 | $600,000 | 08-Jul-2019 | -8.68 | 684 | $877 |
| 404 1575 BEACH AVENUE | $628,000 | $650,000 | 13-Mar-2019 | 1977 | $575,000 | 14-Jul-2019 | -8.44 | 658 | $873 |
| 808 2788 PRINCE EDWARD STREET | $1,105,000 | $718,800 | 16-Sep-2015 | 2013 | $1,015,000 | 17-Jul-2019 | -8.14 | 970 | $1,046 |
| 1007 3663 CROWLEY DRIVE | $652,000 | $658,000 | 06-May-2019 | 2005 | $599,000 | 03-Jul-2019 | -8.13 | 873 | $686 |
| 1105 8588 CORNISH STREET | $909,000 | $721,000 | 15-Sep-2015 | 2014 | $840,000 | 16-Jul-2019 | -7.59 | 816 | $1,029 |
| 418 2388 WESTERN PARKWAY | $898,000 | $920,000 | 20-Feb-2019 | 2005 | $833,000 | 14-Jul-2019 | -7.24 | 923 | $902 |
| 312 1708 COLUMBIA STREET | $739,000 | $469,000 | 10-Nov-2015 | 2013 | $690,000 | 08-Jul-2019 | -6.63 | 596 | $1,157 |
| 1225 68 SMITHE STREET | $1,336,000 | $1,750,000 | 18-Jul-2016 | 2016 | $1,250,000 | 05-Jul-2019 | -6.44 | 914 | $1,367 |
| 308 2130 W 12TH AVENUE | $657,000 | $459,900 | 16-Feb-2016 | 1995 | $619,000 | 17-Jul-2019 | -5.78 | 759 | $815 |
| 601 1616 COLUMBIA STREET | $897,000 | $599,000 | 05-Nov-2015 | 2009 | $848,000 | 15-Jul-2019 | -5.46 | 800 | $1,060 |
| 303 928 RICHARDS STREET | $608,000 | $629,800 | 21-Jan-2019 | 2000 | $575,000 | 10-Jul-2019 | -5.43 | 584 | $984 |
| 502 560 CARDERO STREET | $810,000 | $499,000 | 27-Oct-2015 | 1997 | $766,000 | 18-Jul-2019 | -5.43 | 680 | $1,126 |
| 902 1333 W 11TH AVENUE | $1,612,000 | $1,688,000 | 05-Mar-2019 | 2008 | $1,525,000 | 16-Jul-2019 | -5.40 | 1,320 | $1,155 |
| 102 5639 HAMPTON PLACE | $887,000 | $950,000 | 18-Apr-2019 | 2000 | $847,500 | 12-Jul-2019 | -4.45 | 1,087 | $779 |
| 1112 933 SEYMOUR STREET | $646,000 | $679,000 | 04-Mar-2019 | 1998 | $620,000 | 08-Jul-2019 | -4.02 | 663 | $935 |
| 1610 833 SEYMOUR STREET | $625,000 | $679,800 | 01-May-2019 | 2011 | $600,000 | 11-Jul-2019 | -4.00 | 597 | $1,005 |
| 204 7620 COLUMBIA STREET | $682,000 | $735,000 | 05-Nov-2018 | 1988 | $655,000 | 04-Jul-2019 | -3.96 | 1,129 | $580 |
| 802 3489 ASCOT PLACE | $445,000 | $458,000 | 14-Mar-2019 | 1994 | $428,000 | 04-Jul-2019 | -3.82 | 700 | $611 |
| 2506 1155 SEYMOUR STREET | $1,044,000 | $1,127,500 | 10-May-2019 | 2005 | $1,005,000 | 16-Jul-2019 | -3.74 | 916 | $1,097 |
| 2107 8555 GRANVILLE STREET | $700,000 | $649,900 | 25-May-2017 | 2014 | $674,500 | 15-Jul-2019 | -3.64 | 618 | $1,091 |
| 805 2321 SCOTIA STREET | $638,000 | $469,000 | 21-Sep-2015 | 2011 | $615,000 | 08-Jul-2019 | -3.61 | 573 | $1,073 |
| 702 221 UNION STREET | $667,000 | $569,000 | 10-Oct-2016 | 2010 | $645,000 | 06-Jul-2019 | -3.30 | 662 | $974 |
| 332 3364 MARQUETTE CRESCENT | $542,000 | $499,000 | 23-Oct-2017 | 1983 | $525,000 | 16-Jul-2019 | -3.14 | 1,178 | $445 |
| 1203 455 BEACH CRESCENT | $1,872,000 | $1,899,000 | 25-Apr-2019 | 2005 | $1,815,000 | 12-Jul-2019 | -3.04 | 1,251 | $1,450 |
| 705 1333 W GEORGIA STREET | $617,000 | $639,000 | 06-May-2019 | 2006 | $600,000 | 11-Jul-2019 | -2.76 | 563 | $1,065 |
| 108 7580 COLUMBIA STREET | $706,000 | $828,000 | 23-Jul-2018 | 1988 | $700,000 | 11-Jul-2019 | -0.85 | 1,136 | $616 |
| 115 672 W 6TH AVENUE | $495,000 | $399,800 | 26-Sep-2016 | 2006 | $491,500 | 11-Jul-2019 | -0.71 | 522 | $941 |
| 611 500 W 10TH AVENUE | $1,045,000 | $1,189,000 | 08-Apr-2019 | 1994 | $1,040,000 | 08-Jul-2019 | -0.48 | 1,126 | $923 |
| 302 1685 W 14TH AVENUE | $918,000 | $998,000 | 15-Apr-2019 | 1970 | $915,000 | 03-Jul-2019 | -0.33 | 1,140 | $802 |
| 305 1989 DUNBAR STREET | $483,000 | $479,000 | 13-Sep-2017 | 1997 | $482,500 | 03-Jul-2019 | -0.10 | 550 | $877 |
| 201 138 ATHLETES WAY | $1,639,000 | $2,388,800 | 26-Feb-2018 | 2009 | $1,642,000 | 17-Jul-2019 | 0.18 | 1,476 | $1,112 |
| 1201 111 W GEORGIA STREET | $764,000 | $748,888 | 03-Mar-2017 | 2007 | $770,000 | 14-Jul-2019 | 0.79 | 813 | $947 |
| 111 3551 FOSTER AVENUE | $638,000 | $469,900 | 06-Oct-2016 | 2007 | $665,000 | 05-Jul-2019 | 4.23 | 936 | $710 |
| 502 63 KEEFER PLACE | $869,000 | $695,000 | 22-Mar-2016 | 2000 | $915,000 | 03-Jul-2019 | 5.29 | 962 | $951 |
| 307 3766 W 7TH AVENUE | $1,428,000 | $1,575,000 | 31-Oct-2018 | 1989 | $1,505,000 | 13-Jul-2019 | 5.39 | 1,500 | $1,003 |
| 301 222 N TEMPLETON DRIVE | $441,400 | $369,000 | 01-May-2017 | 1975 | $475,000 | 03-Jul-2019 | 7.61 | 634 | $749 |
| 207 1277 NELSON STREET | $615,000 | $698,800 | 06-May-2019 | 1995 | $665,000 | 06-Jul-2019 | 8.13 | 757 | $878 |
| 311 2333 TRIUMPH STREET | $636,000 | $533,000 | 07-Feb-2016 | 1976 | $690,000 | 13-Jul-2019 | 8.49 | 944 | $730 |
| 102 830 E 7TH AVENUE | $311,300 | $398,000 | 29-Oct-2018 | 1975 | $345,000 | 03-Jul-2019 | 10.83 | 516 | $668 |
| 206 1333 W 11TH AVENUE | $1,145,000 | $1,275,000 | 27-Nov-2017 | 2008 | $1,370,000 | 03-Jul-2019 | 19.65 | 1,102 | $1,243 |
Richmond
| Address | Assessed | True List Price | True List Date | Year Built | Sold Price | Sold Date | % Change from Assessed | Sqft | Price per sqft |
|---|---|---|---|---|---|---|---|---|---|
| 1903 6068 NO. 3 ROAD | $1,322,000 | $1,328,000 | 01-Mar-2019 | 2007 | $950,000 | 13-Jul-2019 | -28.14 | 1,448 | $656 |
| 101 7360 ELMBRIDGE WAY | $498,400 | $500,000 | 29-Apr-2019 | 2008 | $400,100 | 18-Jul-2019 | -19.72 | 726 | $551 |
| 1305 9188 HEMLOCK DRIVE | $703,000 | $699,000 | 17-Apr-2019 | 2006 | $568,000 | 09-Jul-2019 | -19.20 | 950 | $597 |
| 1505 7328 GOLLNER AVENUE | $1,129,000 | $1,020,000 | 30-Apr-2019 | 2015 | $940,000 | 08-Jul-2019 | -16.74 | 995 | $944 |
| 201 9199 TOMICKI AVENUE | $640,000 | $399,990 | 08-Apr-2016 | 2009 | $545,000 | 10-Jul-2019 | -14.84 | 928 | $587 |
| 207 8775 JONES ROAD | $603,000 | $589,000 | 21-Feb-2019 | 1993 | $520,000 | 16-Jul-2019 | -13.76 | 1,240 | $419 |
| 1003 3333 SEXSMITH ROAD | $901,000 | $956,000 | 03-Apr-2019 | 2018 | $780,000 | 10-Jul-2019 | -13.43 | 954 | $817 |
| 1610 8068 WESTMINSTER HIGHWAY | $720,000 | $749,000 | 15-Nov-2018 | 2010 | $638,000 | 10-Jul-2019 | -11.39 | 818 | $779 |
| 708 7708 ALDERBRIDGE WAY | $787,000 | $748,000 | 04-Mar-2019 | 2017 | $700,000 | 08-Jul-2019 | -11.05 | 954 | $733 |
| 906 7888 ACKROYD ROAD | $826,000 | $838,000 | 30-Oct-2018 | 2015 | $738,000 | 03-Jul-2019 | -10.65 | 888 | $831 |
| 209 8040 BLUNDELL ROAD | $354,700 | $339,000 | 20-Mar-2017 | 1975 | $318,200 | 10-Jul-2019 | -10.29 | 948 | $335 |
| 606 8988 PATTERSON ROAD | $537,000 | $539,800 | 07-May-2019 | 2017 | $485,000 | 13-Jul-2019 | -9.68 | 546 | $888 |
| 3001 5511 HOLLYBRIDGE WAY | $705,000 | $518,000 | 01-Oct-2015 | 2014 | $645,000 | 10-Jul-2019 | -8.51 | 1,003 | $643 |
| 703 7535 ALDERBRIDGE WAY | $642,000 | $549,000 | 12-Oct-2017 | 2007 | $603,000 | 08-Jul-2019 | -6.07 | 885 | $681 |
| 1511 5599 COONEY ROAD | $690,000 | $799,000 | 22-Feb-2019 | 2018 | $655,000 | 17-Jul-2019 | -5.07 | 716 | $914 |
| 111 7471 BLUNDELL ROAD | $367,400 | $394,900 | 03-Mar-2019 | 1983 | $351,000 | 15-Jul-2019 | -4.46 | 716 | $490 |
| 1307 5133 GARDEN CITY ROAD | $583,000 | $619,000 | 10-Apr-2019 | 2004 | $568,000 | 10-Jul-2019 | -2.57 | 863 | $658 |
| 212 8751 GENERAL CURRIE ROAD | $389,600 | $245,000 | 23-Sep-2016 | 1989 | $387,000 | 05-Jul-2019 | -0.67 | 752 | $514 |
| 304 7580 MINORU BOULEVARD | $624,000 | $645,900 | 27-Feb-2019 | 1986 | $620,000 | 10-Jul-2019 | -0.64 | 1,381 | $448 |
| 101 5500 ARCADIA ROAD | $481,600 | $499,000 | 03-Jan-2019 | 1989 | $495,000 | 08-Jul-2019 | 2.78 | 963 | $514 |
| 216 7297 MOFFATT ROAD | $432,700 | $458,888 | 08-May-2019 | 1981 | $450,000 | 04-Jul-2019 | 4.00 | 950 | $473 |
| 108 9300 GLENACRES DRIVE | $335,500 | $225,000 | 11-May-2016 | 1971 | $356,000 | 12-Jul-2019 | 6.11 | 720 | $494 |
| 101 5311 CEDARBRIDGE WAY | $438,000 | $529,000 | 10-May-2019 | 2016 | $490,000 | 08-Jul-2019 | 11.87 | 669 | $732 |
Burnaby
| Address | Assessed | True List Price | True List Date | Year Built | Sold Price | Sold Date | % Change from Assessed | Sqft | Price per sqft |
|---|---|---|---|---|---|---|---|---|---|
| 3003 6538 NELSON AVENUE | $1,149,000 | $1,129,900 | 07-Mar-2019 | 2017 | $960,000 | 08-Jul-2019 | -16.45 | 1,012 | $948 |
| 3303 2008 ROSSER AVENUE | $746,000 | $738,800 | 29-May-2018 | 2015 | $627,000 | 16-Jul-2019 | -15.95 | 666 | $941 |
| 1702 6638 DUNBLANE AVENUE | $816,000 | $499,900 | 17-Oct-2015 | 2018 | $699,000 | 20-Jul-2019 | -14.34 | 811 | $861 |
| 704 4250 DAWSON STREET | $722,000 | $699,000 | 02-Apr-2019 | 2008 | $633,000 | 07-Jul-2019 | -12.33 | 856 | $739 |
| 3001 7063 HALL AVENUE | $1,289,000 | $1,125,000 | 06-Oct-2015 | 2007 | $1,135,000 | 08-Jul-2019 | -11.95 | 1,617 | $701 |
| 2006 4400 BUCHANAN STREET | $848,000 | $688,000 | 09-Mar-2016 | 2010 | $750,000 | 18-Jul-2019 | -11.56 | 987 | $759 |
| 3303 6588 NELSON AVENUE | $592,000 | $409,000 | 24-Sep-2015 | 2015 | $524,000 | 04-Jul-2019 | -11.49 | 538 | $973 |
| 2207 4670 ASSEMBLY WAY | $677,000 | $742,000 | 07-Nov-2018 | 2018 | $600,800 | 12-Jul-2019 | -11.26 | 663 | $906 |
| 2306 2133 DOUGLAS ROAD | $596,000 | $426,900 | 30-May-2016 | 2010 | $529,000 | 10-Jul-2019 | -11.24 | 712 | $742 |
| 1403 2008 ROSSER AVENUE | $658,000 | $649,000 | 23-Apr-2019 | 2015 | $595,000 | 04-Jul-2019 | -9.57 | 666 | $893 |
| 1705 4132 HALIFAX STREET | $533,000 | $345,000 | 14-Sep-2015 | 2005 | $490,000 | 17-Jul-2019 | -8.07 | 670 | $731 |
| 2006 6461 TELFORD AVENUE | $609,000 | $445,000 | 07-Mar-2016 | 2011 | $564,000 | 04-Jul-2019 | -7.39 | 553 | $1,019 |
| 301 9603 MANCHESTER DRIVE | $481,000 | $619,900 | 10-Aug-2018 | 1993 | $446,000 | 12-Jul-2019 | -7.28 | 864 | $516 |
| 509 9298 UNIVERSITY CRESCENT | $396,000 | $318,000 | 03-Nov-2016 | 2004 | $372,000 | 07-Jul-2019 | -6.06 | 546 | $681 |
| 810 6538 NELSON AVENUE | $787,000 | $765,000 | 01-May-2019 | 2017 | $747,500 | 17-Jul-2019 | -5.02 | 756 | $988 |
| 1206 7325 ARCOLA STREET | $639,000 | $649,000 | 27-Mar-2019 | 2009 | $610,000 | 08-Jul-2019 | -4.54 | 848 | $719 |
| 2102 5611 GORING STREET | $739,000 | $688,888 | 24-May-2016 | 2008 | $708,800 | 14-Jul-2019 | -4.09 | 980 | $723 |
| 1005 6088 WILLINGDON AVENUE | $659,000 | $688,000 | 19-Mar-2019 | 1999 | $635,000 | 10-Jul-2019 | -3.64 | 929 | $683 |
| 2004 5652 PATTERSON AVENUE | $549,000 | $674,888 | 23-Jan-2019 | 1981 | $530,000 | 15-Jul-2019 | -3.46 | 1,023 | $518 |
| 202 3399 NOEL DRIVE | $610,000 | $499,900 | 18-Nov-2016 | 2017 | $595,000 | 08-Jul-2019 | -2.46 | 829 | $717 |
| 2703 4485 SKYLINE DRIVE | $876,000 | $899,000 | 15-Apr-2019 | 2017 | $865,000 | 09-Jul-2019 | -1.26 | 860 | $1,005 |
| 614 9009 CORNERSTONE MEWS | $386,000 | $327,000 | 17-Aug-2016 | 2008 | $405,000 | 10-Jul-2019 | 4.92 | 594 | $681 |
HEY!
Condo prices are like a Bruce Springsteen song!
“I’m goin down down down….Im goin down…..”( repeat)
happy Housing CRASH Realturds!