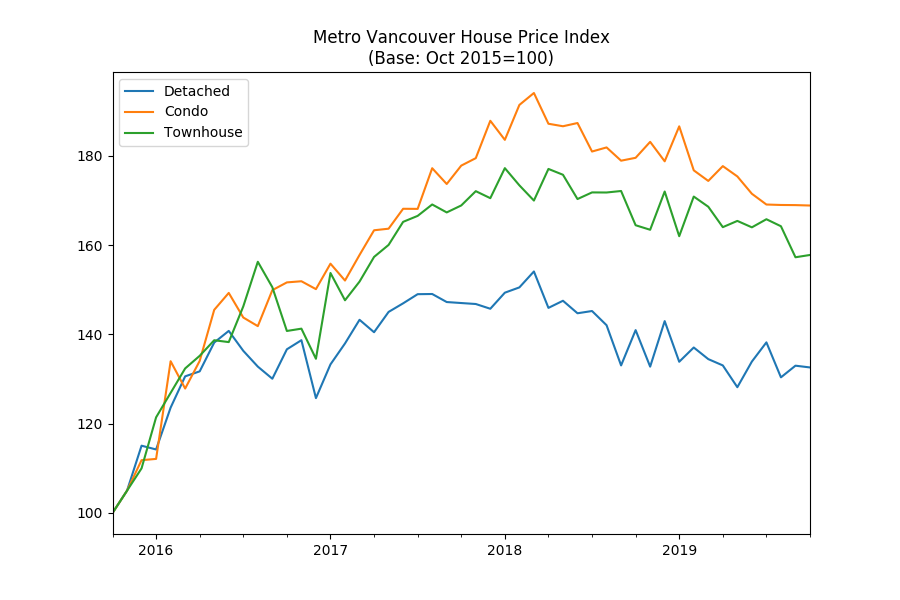
Metro Vancouver detached house prices dipped in October, easing fears that increase in sales witnessed so far in the Fall would translate into worsening affordability.
The OpenHousing Home Price Index for Metro Vancouver detached houses – calculated using the generally-accepted and transparent repeat sales or Case-Shiller method1 – fell 6% year-over-year, the October preliminary update shows.
OpenHousing Home Price Index covers Vancouver, Richmond, Burnaby, West Vancouver, New Westminster, North Vancouver, Delta, Surrey, Port Moody, Coquitlam, Port Coquitlam, Pitt Meadows, Maple Ridge, Lions Bay, Bower Island, Anmore, and Belcarra, Langley and White Rock. Data for Vancouver also include University British Columbia and University Endowment Lands.
Here’s what sales looked like in the last 30 days:
Vancouver
| Address | Sold Price | Assessed | % Δ | True List Price | True List Date | Year Built | Sold Date | Sqft | Price per sqft | Notes |
|---|---|---|---|---|---|---|---|---|---|---|
| 6963 LANARK STREET | $1,450,000 | $1,627,900 | -10.93 | $1,550,000 | 20-Sep-2019 | 1952 | 01-Oct-2019 | 2,272 | $638 | Renovated/updated. |
| 2736 W 41ST AVENUE | $1,803,800 | $1,850,300 | -2.51 | $1,748,800 | 25-Sep-2019 | 1922 | 01-Oct-2019 | 1,961 | $919 | Renovated/updated. |
| 1979 CHARLES STREET | $2,048,000 | $1,499,000 | 36.62 | $1,600,000 | 30-Oct-2017 | 2018 | 01-Oct-2019 | 2,066 | $991 | |
| 1138 W 38TH AVENUE | $4,458,000 | $5,054,000 | -11.79 | $5,288,000 | 24-Jun-2019 | 1995 | 01-Oct-2019 | 4,749 | $938 | |
| 2775 W 30TH AVENUE | $4,220,000 | $4,703,000 | -10.27 | $5,998,000 | 23-Apr-2018 | 1935 | 01-Oct-2019 | 3,528 | $1,196 | Renovated/updated. |
| 1207 DEVONSHIRE CRESCENT | $4,350,000 | $5,497,000 | -20.87 | $6,388,000 | 16-Jan-2016 | 2018 | 02-Oct-2019 | 3,126 | $1,391 | |
| 3337 WORTHINGTON DRIVE | $2,140,000 | $2,017,000 | 6.10 | $2,389,000 | 12-Sep-2019 | 2012 | 02-Oct-2019 | 3,445 | $621 | |
| 4811 JOYCE STREET | $1,400,000 | $1,494,800 | -6.34 | $1,880,000 | 07-Jun-2017 | 1949 | 02-Oct-2019 | 2,000 | $700 | |
| 3441 TRIUMPH STREET | $1,150,000 | $1,356,900 | -15.25 | $1,359,900 | 06-Jun-2019 | 1928 | 02-Oct-2019 | 1,967 | $584 | Renovated/updated. |
| 4507 W 14TH AVENUE | $2,900,000 | $3,039,000 | -4.57 | $4,188,000 | 10-Apr-2018 | 1998 | 02-Oct-2019 | 2,407 | $1,204 | Renovated/updated. |
| 3987 TUPPER STREET | $2,350,000 | $2,724,500 | -13.75 | $2,688,000 | 08-May-2019 | 1929 | 02-Oct-2019 | 3,481 | $675 | |
| 65 W KING EDWARD AVENUE | $2,630,000 | $2,269,800 | 15.87 | $5,000,000 | 15-Apr-2017 | 1939 | 03-Oct-2019 | 3,035 | $866 | |
| 2209 E 7TH AVENUE | $1,510,000 | $1,579,900 | -4.42 | $1,698,000 | 25-Jun-2018 | 1923 | 03-Oct-2019 | 1,894 | $797 | |
| 3654 E PENDER STREET | $1,900,000 | $2,252,000 | -15.63 | $2,080,000 | 17-Jul-2019 | 2015 | 03-Oct-2019 | 4,419 | $429 | |
| 4550 GOTHARD STREET | $1,085,000 | $1,288,500 | -15.79 | $1,488,800 | 30-Apr-2018 | 1926 | 04-Oct-2019 | 1,673 | $648 | |
| 8490 ADERA STREET | $2,398,000 | $2,535,000 | -5.40 | $3,280,000 | 19-May-2017 | 2001 | 04-Oct-2019 | 2,760 | $868 | |
| 2028 W 19TH AVENUE | $6,520,000 | $8,187,000 | -20.36 | $8,288,000 | 23-May-2019 | 1990 | 04-Oct-2019 | 5,817 | $1,120 | Renovated/updated. |
| 2155 E 28TH AVENUE | $1,220,000 | $1,344,900 | -9.29 | $1,340,000 | 17-Jun-2019 | 1946 | 04-Oct-2019 | 1,760 | $693 | |
| 2082 CHARLES STREET | $1,327,000 | $1,236,000 | 7.36 | $1,428,000 | 09-Sep-2019 | 2017 | 05-Oct-2019 | 1,263 | $1,050 | |
| 5828 ORMIDALE STREET | $1,669,500 | $1,695,000 | -1.50 | $1,789,000 | 18-Jun-2019 | 1996 | 05-Oct-2019 | 2,738 | $609 | |
| 2181 W 18TH AVENUE | $4,100,000 | $4,885,000 | -16.07 | $5,688,000 | 14-Jun-2018 | 2008 | 05-Oct-2019 | 4,702 | $871 | |
| 5036 GLADSTONE STREET | $1,494,800 | $1,537,000 | -2.75 | $1,599,000 | 07-May-2019 | 1989 | 06-Oct-2019 | 2,318 | $644 | |
| 4320 MILLER STREET | $785,000 | $810,800 | -3.18 | $799,888 | 30-Sep-2019 | 1989 | 06-Oct-2019 | 1,201 | $653 | |
| 3505 W 12TH AVENUE | $3,200,000 | $2,910,000 | 9.97 | $2,888,000 | 20-Sep-2016 | 2018 | 07-Oct-2019 | 2,815 | $1,136 | |
| 1244 E KING EDWARD AVENUE | $1,250,000 | $1,547,300 | -19.21 | $1,299,000 | 30-Sep-2019 | 1913 | 07-Oct-2019 | 1,823 | $685 | |
| 3226 E 5TH AVENUE | $2,199,900 | $2,055,000 | 7.05 | $2,499,000 | 04-Jun-2019 | 2015 | 07-Oct-2019 | 3,455 | $636 | |
| 3405 W 23RD AVENUE | $2,000,000 | $2,305,700 | -13.26 | $2,188,000 | 29-May-2019 | 1925 | 07-Oct-2019 | 1,700 | $1,176 | Renovated/updated. |
| 6415 CHESTER STREET | $1,350,000 | $1,314,500 | 2.70 | $1,299,000 | 30-Sep-2019 | 1935 | 07-Oct-2019 | 2,106 | $641 | Renovated/updated. |
| 3451 QUEBEC STREET | $1,415,000 | $1,351,000 | 4.74 | $1,398,000 | 30-Sep-2019 | 1905 | 07-Oct-2019 | 1,584 | $893 | Renovated/updated. |
| 3661 CAMBRIDGE STREET | $1,280,000 | $1,340,200 | -4.49 | $1,279,900 | 30-Sep-2019 | 1943 | 07-Oct-2019 | 1,933 | $662 | Renovated/updated. |
| 6761 NEAL STREET | $4,100,000 | $4,118,000 | -0.44 | $4,980,000 | 05-Jul-2018 | 2012 | 07-Oct-2019 | 4,460 | $919 | |
| 2316 PARKER STREET | $1,345,000 | $1,489,000 | -9.67 | $1,538,000 | 26-Apr-2019 | 1912 | 07-Oct-2019 | 2,247 | $598 | |
| 4187 W 14TH AVENUE | $3,100,890 | $3,293,000 | -5.83 | $3,200,000 | 11-Sep-2019 | 2008 | 07-Oct-2019 | 2,415 | $1,284 | |
| 1204 LILLOOET STREET | $1,705,000 | $1,599,000 | 6.63 | $1,768,000 | 30-Sep-2019 | 2011 | 07-Oct-2019 | 2,509 | $679 | |
| 3850 LILLOOET STREET | $1,230,000 | $1,267,700 | -2.97 | $1,288,000 | 22-Aug-2019 | 1974 | 07-Oct-2019 | 2,240 | $549 | Renovated/updated. |
| 948 W 22ND AVENUE | $2,118,000 | $2,357,700 | -10.17 | $2,790,000 | 19-Feb-2018 | 1939 | 08-Oct-2019 | 2,494 | $849 | |
| 2955 GRANT STREET | $1,500,800 | $1,610,000 | -6.78 | $1,600,000 | 06-Jun-2019 | 1991 | 08-Oct-2019 | 2,586 | $580 | Renovated/updated. |
| 326 E 35TH AVENUE | $1,350,000 | $1,552,900 | -13.07 | $1,768,000 | 03-Nov-2017 | 1920 | 08-Oct-2019 | 2,109 | $640 | Renovated/updated. |
| 4975 CHESTER STREET | $1,620,000 | $1,749,700 | -7.41 | $1,798,000 | 24-Jul-2019 | 1950 | 08-Oct-2019 | 1,991 | $813 | |
| 1180 E 19TH AVENUE | $1,635,000 | $1,541,300 | 6.08 | $1,575,000 | 30-Sep-2019 | 1926 | 08-Oct-2019 | 2,287 | $714 | |
| 2078 E 7TH AVENUE | $2,688,000 | $2,027,000 | 32.61 | $2,699,000 | 09-Sep-2019 | 1940 | 08-Oct-2019 | 2,750 | $977 | Renovated/updated. |
| 136 E 44TH AVENUE | $1,290,000 | $1,654,400 | -22.03 | $1,549,000 | 07-Aug-2019 | 1944 | 08-Oct-2019 | 1,841 | $700 | |
| 8567 CORNISH STREET | $2,301,000 | $2,309,000 | -0.35 | $2,469,800 | 22-Jul-2019 | 1995 | 09-Oct-2019 | 3,092 | $744 | Renovated/updated. |
| 1856 W 29TH AVENUE | $3,250,000 | $3,809,900 | -14.70 | $3,750,000 | 12-Jul-2019 | 1924 | 09-Oct-2019 | 3,362 | $966 | Renovated/updated. |
| 3275 E 20TH AVENUE | $1,106,000 | $1,224,500 | -9.68 | $1,290,000 | 25-Jun-2019 | 1949 | 09-Oct-2019 | 1,485 | $744 | Renovated/updated. |
| 2245 WILLIAM STREET | $1,215,000 | $1,418,700 | -14.36 | $1,495,000 | 27-May-2019 | 1929 | 09-Oct-2019 | 1,964 | $618 | |
| 2623 TURNER STREET | $1,380,000 | $1,440,500 | -4.20 | $1,388,000 | 07-Oct-2019 | 1943 | 09-Oct-2019 | 2,993 | $461 | Renovated/updated. |
| 3116 W 13TH AVENUE | $3,510,000 | $3,218,000 | 9.07 | $3,499,000 | 08-Oct-2019 | 2008 | 10-Oct-2019 | 2,916 | $1,203 | |
| 1648 W 63RD AVENUE | $1,500,000 | $1,833,400 | -18.18 | $1,549,000 | 08-Oct-2019 | 1930 | 10-Oct-2019 | 1,950 | $769 | |
| 371 E 16TH AVENUE | $1,500,000 | $1,609,800 | -6.82 | $2,100,000 | 27-Jul-2017 | 1926 | 11-Oct-2019 | 2,157 | $695 | Renovated/updated. |
| 3058 18TH AVENUE | $1,500,000 | $1,571,800 | -4.57 | $1,680,000 | 29-Aug-2019 | 1966 | 12-Oct-2019 | 2,794 | $536 | Renovated/updated. |
| 993 BROUGHTON STREET | $2,600,000 | $2,991,000 | -13.07 | $3,288,890 | 03-Apr-2019 | 1905 | 12-Oct-2019 | 4,026 | $645 | Renovated/updated. |
| 6950 INVERNESS STREET | $2,250,000 | $2,157,000 | 4.31 | $2,298,000 | 20-Sep-2019 | 2017 | 13-Oct-2019 | 3,550 | $633 | |
| 3569 W 21ST AVENUE | $2,345,000 | $2,449,000 | -4.25 | $2,398,000 | 08-Oct-2019 | 1930 | 13-Oct-2019 | 2,511 | $933 | Renovated/updated. |
| 6158 BRUCE STREET | $1,225,000 | $1,322,000 | -7.34 | $1,199,000 | 06-Oct-2019 | 2000 | 14-Oct-2019 | 1,855 | $660 | |
| 6892 RADISSON STREET | $950,000 | $1,094,100 | -13.17 | $1,199,000 | 03-Sep-2019 | 1980 | 14-Oct-2019 | 1,850 | $513 | |
| 2646 MCGILL STREET | $1,125,000 | $1,202,300 | -6.43 | $1,138,800 | 21-Aug-2019 | 1928 | 14-Oct-2019 | 1,520 | $740 | Renovated/updated. |
| 3164 E 46TH AVENUE | $1,130,000 | $1,271,200 | -11.11 | $1,150,000 | 30-Sep-2019 | 1962 | 15-Oct-2019 | 1,709 | $661 | |
| 2208 E 42ND AVENUE | $1,320,000 | $1,307,000 | 0.99 | $1,538,000 | 04-Jul-2019 | 1993 | 15-Oct-2019 | 1,746 | $756 | Renovated/updated. |
| 2590 PARKER STREET | $1,248,500 | $1,246,200 | 0.18 | $1,349,000 | 16-Sep-2019 | 1944 | 15-Oct-2019 | 1,821 | $685 | Renovated/updated. |
| 3611 OXFORD STREET | $1,590,000 | $1,589,000 | 0.06 | $1,598,000 | 11-Oct-2019 | 1980 | 15-Oct-2019 | 2,802 | $567 | Renovated/updated. |
| 7218 CARTIER STREET | $2,779,000 | $3,475,000 | -20.03 | $2,998,000 | 30-Sep-2019 | 1993 | 15-Oct-2019 | 4,122 | $674 | |
| 1083 W 43RD AVENUE | $3,150,000 | $3,969,000 | -20.63 | $3,899,000 | 25-Jul-2019 | 1994 | 15-Oct-2019 | 4,100 | $768 | |
| 3772 W 11TH AVENUE | $3,150,000 | $3,449,000 | -8.67 | $3,880,000 | 29-Jul-2019 | 1996 | 15-Oct-2019 | 3,292 | $956 | |
| 4818 RUPERT STREET | $1,350,000 | $1,355,000 | -0.37 | $4,260,000 | 19-Apr-2016 | 1999 | 15-Oct-2019 | 2,099 | $643 | |
| 3798 PUGET DRIVE | $3,000,000 | $3,192,000 | -6.02 | $3,298,000 | 01-Aug-2019 | 2015 | 16-Oct-2019 | 2,997 | $1,001 | Renovated/updated. |
| 3332 DEERING ISLAND PLACE | $2,800,000 | $4,003,000 | -30.05 | $5,290,000 | 01-May-2018 | 1992 | 17-Oct-2019 | 3,422 | $818 | |
| 6775 WEST BOULEVARD | $3,340,000 | $3,390,000 | -1.47 | $5,288,000 | 09-Jun-2017 | 1915 | 17-Oct-2019 | 4,393 | $760 | Renovated/updated. |
| 2244 W 45TH AVENUE | $1,940,000 | $2,194,900 | -11.61 | $1,899,900 | 10-Oct-2019 | 1916 | 17-Oct-2019 | 3,010 | $644 | |
| 3555 W 28TH AVENUE | $4,500,000 | $4,571,000 | -1.55 | $6,888,000 | 13-Aug-2018 | 2016 | 18-Oct-2019 | 3,927 | $1,145 | |
| 2211 E 61ST AVENUE | $1,488,000 | $1,497,000 | -0.60 | $1,690,000 | 30-May-2019 | 1952 | 20-Oct-2019 | 1,924 | $773 | Renovated/updated. |
| 4206 BEATRICE STREET | $1,538,100 | $1,312,200 | 17.22 | $1,575,000 | 10-Oct-2019 | 1920 | 20-Oct-2019 | 3,075 | $500 | Renovated/updated. |
| 2707 POINT GREY ROAD | $15,500,000 | $16,395,000 | -5.46 | $28,000,000 | 13-Jun-2016 | 1994 | 20-Oct-2019 | 5,269 | $2,941 | |
| 3669 MAXWELL STREET | $1,155,000 | $1,092,000 | 5.77 | $1,149,900 | 15-Oct-2019 | 2012 | 20-Oct-2019 | 1,128 | $1,023 | |
| 8515 CORNISH STREET | $2,210,000 | $2,296,000 | -3.75 | $2,168,800 | 15-Oct-2019 | 1994 | 21-Oct-2019 | 2,971 | $743 | Renovated/updated. |
| 4077 W 36TH AVENUE | $5,200,000 | $5,700,000 | -8.77 | $5,198,000 | 18-Oct-2019 | 2010 | 21-Oct-2019 | 4,913 | $1,058 | |
| 825 E 31ST AVENUE | $2,335,000 | $1,653,000 | 41.26 | $2,349,000 | 18-Oct-2019 | 2015 | 21-Oct-2019 | 2,431 | $960 | |
| 3757 W 29TH AVENUE | $2,480,000 | $3,226,600 | -23.14 | $2,850,000 | 28-Jun-2019 | 1950 | 22-Oct-2019 | 3,511 | $706 | |
| 1561 KITCHENER STREET | $1,470,000 | $1,738,000 | -15.42 | $1,685,000 | 12-Jun-2019 | 1910 | 23-Oct-2019 | 2,538 | $579 | Renovated/updated. |
| 4427 W 5TH AVENUE | $3,950,000 | $5,105,000 | -22.62 | $4,500,000 | 10-Jul-2019 | 1930 | 23-Oct-2019 | 2,842 | $1,389 | |
| 4334 ST. CATHERINES STREET | $1,650,000 | $1,731,000 | -4.68 | $1,599,000 | 15-Oct-2019 | 1988 | 23-Oct-2019 | 2,653 | $621 | Renovated/updated. |
| 3362 POINT GREY ROAD | $4,480,000 | $3,775,000 | 18.68 | $6,800,000 | 26-Apr-2016 | 1912 | 24-Oct-2019 | 3,276 | $1,367 | |
| 2566 MCBAIN AVENUE | $2,805,000 | $3,258,800 | -13.93 | $3,168,800 | 07-Oct-2019 | 1955 | 25-Oct-2019 | 2,017 | $1,390 |
63 out of 83 sold below assessed with a median sold price of -5.83
Richmond
| Address | Sold Price | Assessed | % Δ | True List Price | True List Date | Year Built | Sold Date | Sqft | Price per sqft | Notes |
|---|---|---|---|---|---|---|---|---|---|---|
| 5377 MYTKO CRESCENT | $1,828,570 | $1,819,000 | 0.53 | $2,388,000 | 26-Jun-2019 | 2017 | 01-Oct-2019 | 2,868 | $637 | |
| 3571 SABLE AVENUE | $1,985,710 | $2,405,000 | -17.43 | $1,588,000 | 12-Dec-2016 | 2016 | 01-Oct-2019 | 3,358 | $591 | |
| 12591 CAMERON DRIVE | $1,425,000 | $1,542,000 | -7.59 | $1,728,000 | 15-Aug-2018 | 1994 | 01-Oct-2019 | 3,134 | $454 | |
| 5591 LUDLOW ROAD | $1,780,000 | $1,879,500 | -5.29 | $1,785,000 | 23-Sep-2019 | 1959 | 01-Oct-2019 | 1,224 | $1,454 | Renovated/updated. |
| 5228 WOODWARDS ROAD | $1,880,000 | $2,206,000 | -14.78 | $2,480,000 | 08-Aug-2017 | 2006 | 01-Oct-2019 | 3,236 | $580 | |
| 10211 NO. 5 ROAD | $1,470,000 | $1,408,000 | 4.40 | $1,699,000 | 07-Mar-2018 | 2016 | 02-Oct-2019 | 2,776 | $529 | |
| 11215 7TH AVENUE | $1,240,000 | $1,417,000 | -12.49 | $1,278,000 | 03-Sep-2019 | 1993 | 02-Oct-2019 | 1,980 | $626 | |
| 10820 ANAHIM DRIVE | $1,155,000 | $1,401,800 | -17.61 | $1,688,000 | 20-Apr-2017 | 1974 | 02-Oct-2019 | 1,760 | $656 | |
| 12451 JENSEN DRIVE | $1,245,000 | $1,352,000 | -7.91 | $1,498,000 | 01-Jun-2018 | 1993 | 02-Oct-2019 | 2,510 | $496 | |
| 4380 GRANVILLE AVENUE | $1,570,000 | $1,647,100 | -4.68 | $1,588,000 | 18-Jul-2019 | 1959 | 03-Oct-2019 | 1,740 | $902 | |
| 8271 DEMOREST PLACE | $1,260,000 | $1,345,000 | -6.32 | $1,398,900 | 29-May-2019 | 1976 | 03-Oct-2019 | 1,924 | $654 | Renovated/updated. |
| 11900 KINGFISHER DRIVE | $1,985,000 | $1,998,000 | -0.65 | $2,085,000 | 21-Aug-2019 | 2016 | 04-Oct-2019 | 2,672 | $742 | |
| 8291 RIDEAU DRIVE | $1,343,000 | $1,486,200 | -9.64 | $1,480,000 | 24-Apr-2017 | 1976 | 04-Oct-2019 | 2,230 | $602 | |
| 6571 WHITEOAK DRIVE | $1,530,000 | $1,906,000 | -19.73 | $2,200,000 | 06-Nov-2017 | 1979 | 04-Oct-2019 | 1,890 | $809 | |
| 11491 KING ROAD | $1,730,000 | $1,906,000 | -9.23 | $1,698,800 | 27-Sep-2019 | 2005 | 05-Oct-2019 | 3,369 | $513 | |
| 8360 FAIRDELL CRESCENT | $1,598,000 | $2,163,900 | -26.15 | $2,000,000 | 12-Jun-2018 | 1964 | 05-Oct-2019 | 2,180 | $733 | Renovated/updated. |
| 4560 PENDLEBURY ROAD | $3,285,710 | $2,943,000 | 11.64 | $4,180,000 | 25-Mar-2019 | 2017 | 05-Oct-2019 | 4,021 | $817 | |
| 9591 BAKERVIEW DRIVE | $1,840,000 | $1,970,000 | -6.60 | $2,188,000 | 25-Mar-2019 | 1999 | 06-Oct-2019 | 3,850 | $477 | |
| 5060 MERGANSER DRIVE | $1,500,000 | $1,719,000 | -12.74 | $1,699,000 | 17-Jul-2019 | 1975 | 06-Oct-2019 | 1,995 | $751 | |
| 4111 CAMPOBELLO PLACE | $1,110,000 | $1,362,100 | -18.51 | $1,390,000 | 03-Apr-2019 | 1980 | 07-Oct-2019 | 1,548 | $717 | Renovated/updated. |
| 3640 SABLE AVENUE | $1,568,000 | $1,534,500 | 2.18 | $1,638,000 | 27-Sep-2019 | 1974 | 07-Oct-2019 | 2,737 | $572 | Renovated/updated. |
| 5620 LUDLOW ROAD | $2,500,000 | $2,645,000 | -5.48 | $2,788,000 | 30-Jul-2019 | 2011 | 08-Oct-2019 | 3,626 | $689 | |
| 5820 EASTERBROOK ROAD | $1,550,000 | $1,910,100 | -18.85 | $1,788,000 | 27-Jul-2019 | 1958 | 08-Oct-2019 | 1,100 | $1,409 | |
| 3620 SABLE AVENUE | $1,260,000 | $1,540,500 | -18.21 | $1,749,000 | 07-Mar-2016 | 1973 | 09-Oct-2019 | 1,500 | $840 | Renovated/updated. |
| 5180 BUNTING AVENUE | $1,593,000 | $1,676,000 | -4.95 | $1,758,800 | 04-Feb-2019 | 1985 | 09-Oct-2019 | 2,707 | $588 | Renovated/updated. |
| 7200 BELAIR DRIVE | $1,950,000 | $2,144,000 | -9.05 | $2,650,000 | 10-Sep-2018 | 1993 | 10-Oct-2019 | 4,110 | $474 | |
| 6100 MARA CRESCENT | $1,200,000 | $1,493,300 | -19.64 | $1,420,000 | 20-Sep-2019 | 1963 | 10-Oct-2019 | 1,704 | $704 | |
| 4531 STEVESTON HIGHWAY | $880,000 | $1,375,000 | -36.00 | $1,220,000 | 29-Mar-2019 | 1980 | 10-Oct-2019 | 1,278 | $688 | |
| 5611 FORSYTH CRESCENT | $1,886,000 | $2,187,000 | -13.76 | $2,598,000 | 04-Aug-2017 | 1988 | 12-Oct-2019 | 4,021 | $469 | |
| 10560 SOUTHRIDGE ROAD | $2,100,000 | $2,291,000 | -8.34 | $2,249,890 | 03-Oct-2019 | 2006 | 12-Oct-2019 | 3,923 | $535 | |
| 7977 BOWCOCK ROAD | $1,800,000 | $1,735,000 | 3.75 | $1,938,000 | 04-Oct-2019 | 12-Oct-2019 | 2,980 | $604 | ||
| 5911 GOLDENEYE PLACE | $1,400,000 | $1,472,600 | -4.93 | $1,598,000 | 08-Aug-2018 | 1973 | 12-Oct-2019 | 2,163 | $647 | Renovated/updated. |
| 10411 GILMORE CRESCENT | $1,350,480 | $1,340,000 | 0.78 | $1,625,000 | 04-Feb-2019 | 2017 | 13-Oct-2019 | 2,359 | $572 | |
| 10831 SPRINGWOOD CRESCENT | $1,360,000 | $1,545,700 | -12.01 | $1,950,000 | 12-Jun-2018 | 1970 | 14-Oct-2019 | 2,567 | $529 | |
| 5411 CLEARWATER DRIVE | $2,047,620 | $1,950,000 | 5.01 | $2,588,000 | 25-Feb-2019 | 2018 | 14-Oct-2019 | 3,415 | $599 | |
| 4251 CANDLEWOOD DRIVE | $2,620,000 | $2,513,000 | 4.26 | $3,680,000 | 19-Nov-2018 | 2017 | 15-Oct-2019 | 3,937 | $665 | |
| 9900 SEACASTLE DRIVE | $1,070,000 | $1,192,400 | -10.27 | $1,088,000 | 10-Oct-2019 | 1978 | 15-Oct-2019 | 1,905 | $561 | Renovated/updated. |
| 10320 WILLIAMS ROAD | $1,328,000 | $1,241,000 | 7.01 | $1,468,000 | 27-May-2019 | 2010 | 15-Oct-2019 | 2,163 | $613 | |
| 11140 7TH AVENUE | $950,000 | $1,283,700 | -26.00 | $997,000 | 17-Aug-2019 | 1972 | 16-Oct-2019 | 1,424 | $667 | Renovated/updated. |
| 12171 MELLIS DRIVE | $1,467,000 | $1,501,000 | -2.27 | $1,568,000 | 17-Sep-2019 | 1993 | 16-Oct-2019 | 3,400 | $431 | Renovated/updated. |
| 8540 LITTLEMORE PLACE | $1,370,000 | $1,525,100 | -10.17 | $1,398,000 | 10-Oct-2019 | 1959 | 16-Oct-2019 | 1,668 | $821 | |
| 8531 PIGOTT ROAD | $1,830,000 | $1,970,000 | -7.11 | $1,990,000 | 24-Jun-2019 | 2010 | 16-Oct-2019 | 3,136 | $583 | |
| 4191 LOUISBURG PLACE | $1,210,000 | $1,335,700 | -9.41 | $1,280,000 | 13-Aug-2019 | 1980 | 16-Oct-2019 | 1,741 | $695 | Renovated/updated. |
| 3315 TRUTCH AVENUE | $1,680,000 | $1,974,000 | -14.89 | $2,088,000 | 16-Apr-2019 | 2004 | 16-Oct-2019 | 2,475 | $678 | |
| 10340 BUTTERMERE DRIVE | $1,600,000 | $1,930,400 | -17.12 | $1,999,000 | 09-Feb-2016 | 1973 | 17-Oct-2019 | 2,075 | $771 | |
| 10640 HOLLYBANK DRIVE | $2,190,480 | $1,715,000 | 27.72 | $2,398,000 | 22-Jul-2019 | 2018 | 18-Oct-2019 | 3,268 | $670 | |
| 3168 FRANCIS ROAD | $1,325,000 | $1,323,000 | 0.15 | $1,468,000 | 29-May-2019 | 2001 | 21-Oct-2019 | 1,895 | $699 | |
| 4786 MAHOOD DRIVE | $1,228,000 | $1,374,000 | -10.63 | $1,400,000 | 16-Apr-2019 | 1980 | 21-Oct-2019 | 1,922 | $638 | Renovated/updated. |
| 10320 ALBION ROAD | $1,080,000 | $1,393,500 | -22.50 | $1,320,000 | 07-Mar-2019 | 1958 | 21-Oct-2019 | 1,644 | $656 | Renovated/updated. |
38 out of 49 sold below assessed with a median sold price of -9.05
Burnaby
| Address | Sold Price | Assessed | % Δ | True List Price | True List Date | Year Built | Sold Date | Sqft | Price per sqft | Notes |
|---|---|---|---|---|---|---|---|---|---|---|
| 6560 ALBERY PLACE | $1,868,000 | $1,699,000 | 9.95 | $1,988,000 | 04-Feb-2019 | 1988 | 01-Oct-2019 | 3,993 | $467 | |
| 7857 MEADOWOOD CLOSE | $1,545,000 | $1,662,000 | -7.04 | $1,750,000 | 03-Jun-2019 | 1983 | 01-Oct-2019 | 2,773 | $557 | |
| 7375 NEWCOMBE STREET | $910,000 | $1,147,400 | -20.69 | $1,448,000 | 09-Aug-2017 | 1955 | 01-Oct-2019 | 2,040 | $446 | |
| 5069 MANOR STREET | $1,100,000 | $1,445,000 | -23.88 | $1,788,000 | 01-Apr-2017 | 1962 | 02-Oct-2019 | 2,000 | $550 | |
| 306 GAMMA AVENUE | $1,290,000 | $1,106,000 | 16.64 | $1,398,000 | 29-Apr-2019 | 1973 | 02-Oct-2019 | 2,781 | $463 | Renovated/updated. |
| 77 N SPRINGER AVENUE | $1,900,000 | $1,661,000 | 14.39 | $1,999,900 | 13-Mar-2019 | 2018 | 02-Oct-2019 | 2,469 | $769 | |
| 1770 CLIFF AVENUE | $1,700,000 | $1,582,000 | 7.46 | $1,788,000 | 24-Sep-2019 | 1966 | 02-Oct-2019 | 3,018 | $563 | Renovated/updated. |
| 118 WARWICK AVENUE | $1,663,810 | $1,490,000 | 11.67 | $1,899,000 | 15-Jul-2019 | 2018 | 03-Oct-2019 | 2,373 | $701 | |
| 4409 DUNDAS STREET | $1,285,000 | $1,465,900 | -12.34 | $1,523,000 | 13-Nov-2018 | 1947 | 03-Oct-2019 | 756 | $1,699 | |
| 7365 IMPERIAL STREET | $1,875,000 | $2,055,000 | -8.76 | $2,390,000 | 02-Oct-2018 | 2011 | 03-Oct-2019 | 3,957 | $473 | |
| 3851 FRANCES STREET | $1,263,000 | $1,224,500 | 3.14 | $1,249,000 | 15-Jan-2018 | 1910 | 03-Oct-2019 | 2,285 | $552 | Renovated/updated. |
| 4145 ETON STREET | $1,163,000 | $1,204,600 | -3.45 | $1,198,000 | 01-Oct-2019 | 1948 | 04-Oct-2019 | 1,620 | $717 | |
| 5035 PIONEER AVENUE | $1,250,000 | $1,797,700 | -30.47 | $1,499,000 | 08-Jul-2019 | 1958 | 05-Oct-2019 | 2,396 | $521 | |
| 6475 BURNS STREET | $1,150,000 | $1,398,800 | -17.79 | $1,438,800 | 09-Oct-2018 | 1955 | 05-Oct-2019 | 2,320 | $495 | Renovated/updated. |
| 7570 BOUNDARY ROAD | $1,145,000 | $1,140,800 | 0.37 | $1,199,000 | 04-Sep-2019 | 1955 | 06-Oct-2019 | 2,390 | $479 | |
| 4407 WILDWOOD CRESCENT | $1,500,000 | $1,626,300 | -7.77 | $1,200,000 | 21-Feb-2016 | 1955 | 06-Oct-2019 | 2,134 | $702 | Renovated/updated. |
| 1370 EASTLAWN DRIVE | $1,522,500 | $1,623,000 | -6.19 | $1,575,000 | 30-Sep-2019 | 1973 | 06-Oct-2019 | 3,200 | $475 | |
| 7990 HUNTER STREET | $1,603,000 | $1,675,200 | -4.31 | $1,680,000 | 27-Sep-2019 | 1964 | 07-Oct-2019 | 2,323 | $690 | Renovated/updated. |
| 1488 TARALAWN COURT | $1,736,000 | $1,866,000 | -6.97 | $1,999,000 | 15-Jul-2019 | 1973 | 07-Oct-2019 | 2,783 | $623 | Renovated/updated. |
| 6009 PATRICK STREET | $2,155,000 | $2,311,000 | -6.75 | $2,990,000 | 24-Feb-2017 | 2016 | 08-Oct-2019 | 3,630 | $593 | |
| 7677 HILDA STREET | $1,721,900 | $1,508,000 | 14.18 | $1,350,000 | 24-Jan-2018 | 2018 | 08-Oct-2019 | 3,258 | $528 | |
| 2669 MOUNTVIEW PLACE | $1,078,000 | $1,148,500 | -6.14 | $998,000 | 01-Oct-2019 | 1968 | 09-Oct-2019 | 1,512 | $712 | |
| 5387 RUGBY STREET | $2,340,000 | $2,638,000 | -11.30 | $2,688,000 | 27-May-2019 | 1990 | 09-Oct-2019 | 3,789 | $617 | Renovated/updated. |
| 8755 CREST DRIVE | $1,160,000 | $1,272,800 | -8.86 | $1,298,000 | 12-Aug-2019 | 1955 | 09-Oct-2019 | 2,314 | $501 | |
| 6937 CARNEGIE STREET | $1,150,000 | $1,485,400 | -22.58 | $1,288,800 | 27-Aug-2019 | 1959 | 09-Oct-2019 | 2,070 | $555 | Renovated/updated. |
| 7623 LAWRENCE DRIVE | $1,368,000 | $1,348,000 | 1.48 | $1,368,000 | 08-Oct-2019 | 1979 | 10-Oct-2019 | 2,596 | $526 | |
| 6867 BALMORAL STREET | $1,330,000 | $1,354,000 | -1.77 | $1,399,900 | 24-Sep-2019 | 1981 | 10-Oct-2019 | 3,000 | $443 | |
| 5126 PATRICK STREET | $1,250,000 | $1,587,100 | -21.24 | $1,480,000 | 06-Apr-2019 | 1918 | 10-Oct-2019 | 3,200 | $390 | |
| 7411 GOVERNMENT ROAD | $1,550,000 | $1,799,000 | -13.84 | $1,650,000 | 19-Sep-2019 | 1960 | 10-Oct-2019 | 2,271 | $682 | |
| 4791 CARSON PLACE | $1,250,000 | $1,492,000 | -16.22 | $1,425,000 | 19-Aug-2019 | 1962 | 11-Oct-2019 | 2,871 | $435 | |
| 3276 CARDINAL DRIVE | $1,465,000 | $1,744,300 | -16.01 | $1,899,000 | 25-Oct-2018 | 1972 | 11-Oct-2019 | 2,647 | $553 | |
| 4105 CAMBRIDGE STREET | $1,328,000 | $1,342,000 | -1.04 | $1,418,000 | 19-Jun-2019 | 1977 | 11-Oct-2019 | 2,471 | $537 | Renovated/updated. |
| 5904 SUMAS STREET | $1,150,000 | $1,492,900 | -22.97 | $1,448,000 | 12-Jun-2019 | 1955 | 11-Oct-2019 | 2,635 | $436 | |
| 7881 ROSEWOOD STREET | $1,657,000 | $1,735,000 | -4.50 | $1,738,000 | 27-Sep-2019 | 2006 | 12-Oct-2019 | 3,702 | $447 | |
| 4207 KITCHENER STREET | $1,275,000 | $1,435,800 | -11.20 | $1,450,000 | 11-Sep-2019 | 1947 | 12-Oct-2019 | 2,070 | $615 | |
| 6801 CURTIS STREET | $1,256,000 | $1,390,000 | -9.64 | $1,390,000 | 17-Jun-2019 | 1969 | 12-Oct-2019 | 2,700 | $465 | Renovated/updated. |
| 3888 DUBOIS STREET | $2,000,000 | $2,000,000 | 0.00 | $2,038,880 | 12-Jun-2019 | 2014 | 14-Oct-2019 | 4,239 | $471 | |
| 4088 BOUNDARY ROAD | $1,445,000 | $1,465,000 | -1.37 | $1,648,000 | 09-Jul-2018 | 2017 | 15-Oct-2019 | 2,208 | $654 | |
| 1875 CLIFF AVENUE | $2,500,000 | $1,627,000 | 53.66 | $2,898,000 | 19-Jun-2019 | 2018 | 15-Oct-2019 | 4,582 | $545 | |
| 1352 GLEN ABBEY DRIVE | $1,400,000 | $1,411,000 | -0.78 | $1,900,000 | 26-Apr-2017 | 1980 | 15-Oct-2019 | 3,058 | $457 | |
| 4130 TRINITY STREET | $2,100,000 | $2,371,000 | -11.43 | $2,399,000 | 13-Nov-2018 | 1949 | 16-Oct-2019 | 2,496 | $841 | |
| 225 N GILMORE AVENUE | $1,125,000 | $1,419,700 | -20.76 | $1,465,000 | 28-Nov-2018 | 1908 | 16-Oct-2019 | 2,329 | $483 | |
| 6678 KITCHENER STREET | $1,185,000 | $1,590,300 | -25.49 | $1,348,000 | 03-Sep-2019 | 1968 | 16-Oct-2019 | 2,150 | $551 | |
| 3941 YALE STREET | $1,588,000 | $1,641,000 | -3.23 | $1,638,000 | 01-Sep-2019 | 1948 | 16-Oct-2019 | 2,948 | $538 | Renovated/updated. |
| 5850 BUCKINGHAM AVENUE | $2,320,000 | $2,267,000 | 2.34 | $2,388,000 | 09-Sep-2019 | 1958 | 18-Oct-2019 | 3,645 | $636 | Renovated/updated. |
| 7283 12TH AVENUE | $1,055,000 | $1,225,000 | -13.88 | $1,200,000 | 10-Apr-2019 | 1930 | 18-Oct-2019 | 1,646 | $640 | |
| 7287 BARNET ROAD | $1,090,000 | $1,317,400 | -17.26 | $1,350,000 | 29-Apr-2019 | 1949 | 19-Oct-2019 | 1,723 | $632 | |
| 7674 STANLEY CRESCENT | $1,950,000 | $2,308,400 | -15.53 | $2,398,000 | 17-Jan-2018 | 1963 | 21-Oct-2019 | 1,957 | $996 | Renovated/updated. |
| 4058 GEORGIA STREET | $1,300,000 | $1,473,400 | -11.77 | $1,395,000 | 06-Sep-2019 | 1951 | 24-Oct-2019 | 1,970 | $659 | |
| 326 DELTA AVENUE | $1,986,000 | $2,281,000 | -12.93 | $2,998,880 | 18-Jul-2017 | 1993 | 24-Oct-2019 | 5,171 | $384 |
38 out of 49 sold below assessed with a median sold price of -7.77
West Vancouver
| Address | Sold Price | Assessed | % Δ | True List Price | True List Date | Year Built | Sold Date | Sqft | Price per sqft | Notes |
|---|---|---|---|---|---|---|---|---|---|---|
| 2215 JEFFERSON AVENUE | $3,025,000 | $3,426,000 | -11.70 | $3,498,000 | 25-Jun-2019 | 2009 | 01-Oct-2019 | 4,052 | $746 | |
| 1437 KINGS AVENUE | $2,000,000 | $2,424,000 | -17.49 | $2,290,000 | 02-Apr-2019 | 1939 | 01-Oct-2019 | 2,626 | $761 | Renovated/updated. |
| 925 BRAESIDE STREET | $3,739,000 | $3,754,000 | -0.40 | $3,898,000 | 25-Sep-2019 | 1997 | 02-Oct-2019 | 3,285 | $1,138 | |
| 2048 GORDON AVENUE | $2,225,000 | $2,325,000 | -4.30 | $2,549,000 | 08-Apr-2019 | 1988 | 02-Oct-2019 | 2,849 | $780 | Renovated/updated. |
| 4877 THE DALE | $2,130,000 | $2,129,000 | 0.05 | $2,550,000 | 04-Feb-2019 | 1993 | 02-Oct-2019 | 3,647 | $584 | Renovated/updated. |
| 4144 RIPPLE ROAD | $2,224,000 | $2,749,000 | -19.10 | $2,631,000 | 06-Feb-2019 | 1964 | 03-Oct-2019 | 3,372 | $659 | Renovated/updated. |
| 1487 20TH STREET | $1,990,000 | $2,456,000 | -18.97 | $2,239,000 | 03-Jun-2019 | 1927 | 04-Oct-2019 | 3,208 | $620 | |
| 450 MACBETH CRESCENT | $1,720,000 | $2,296,300 | -25.10 | $2,720,000 | 21-Jan-2019 | 1953 | 06-Oct-2019 | 2,914 | $590 | |
| 4774 ESTEVAN PLACE | $1,570,000 | $2,186,000 | -28.18 | $2,138,000 | 25-Jul-2016 | 1967 | 06-Oct-2019 | 2,106 | $745 | Renovated/updated. |
| 8540 CITRUS WYND | $4,850,000 | $6,652,000 | -27.09 | $8,800,000 | 09-May-2016 | 2015 | 06-Oct-2019 | 5,868 | $826 | |
| 4397 ERWIN DRIVE | $3,700,000 | $3,968,000 | -6.75 | $4,197,000 | 02-Jul-2019 | 2002 | 08-Oct-2019 | 6,079 | $608 | |
| 811 BURLEY DRIVE | $1,700,000 | $1,990,400 | -14.59 | $1,799,000 | 25-Mar-2019 | 1957 | 09-Oct-2019 | 2,761 | $615 | |
| 6441 FOX STREET | $1,430,000 | $1,534,000 | -6.78 | $1,500,000 | 19-Aug-2019 | 1950 | 12-Oct-2019 | 1,584 | $902 | |
| 2236 BOULDER COURT | $4,480,000 | $4,358,000 | 2.80 | $4,978,000 | 27-Aug-2019 | 2004 | 13-Oct-2019 | 5,460 | $820 | |
| 7170 CLIFF ROAD | $3,525,000 | $2,730,000 | 29.12 | $3,690,000 | 10-Sep-2019 | 2013 | 13-Oct-2019 | 4,011 | $878 | |
| 5225 KEITH ROAD | $2,275,000 | $2,910,000 | -21.82 | $3,198,000 | 19-Aug-2019 | 1974 | 14-Oct-2019 | 3,054 | $744 | |
| 5102 MEADFEILD ROAD | $3,420,000 | $3,245,000 | 5.39 | $5,698,000 | 02-Aug-2018 | 1989 | 19-Oct-2019 | 4,227 | $809 | |
| 4322 ERWIN DRIVE | $1,690,000 | $1,601,000 | 5.56 | $1,690,000 | 13-Sep-2019 | 1948 | 20-Oct-2019 | 1,508 | $1,120 | Renovated/updated. |
| 1145 GORDON AVENUE | $2,420,000 | $2,626,000 | -7.84 | $2,498,000 | 18-Oct-2019 | 1986 | 24-Oct-2019 | 2,729 | $886 | |
| 65 LAURIE CRESCENT | $1,640,000 | $2,103,100 | -22.02 | $1,688,000 | 23-Oct-2019 | 1957 | 25-Oct-2019 | 2,696 | $608 |
16 out of 21 sold below assessed with a median sold price of -11.70
New Westminster
| Address | Sold Price | Assessed | % Δ | True List Price | True List Date | Year Built | Sold Date | Sqft | Price per sqft | Notes |
|---|---|---|---|---|---|---|---|---|---|---|
| 327 E SIXTH AVENUE | $790,000 | $714,000 | 10.64 | $839,000 | 09-Sep-2019 | 1988 | 01-Oct-2019 | 932 | $847 | Renovated/updated. |
| 902 CHILLIWACK STREET | $1,660,000 | $1,538,000 | 7.93 | $1,800,000 | 01-Jun-2019 | 2004 | 03-Oct-2019 | 3,845 | $431 | |
| 1309 DAN LEE AVENUE | $1,060,000 | $1,115,000 | -4.93 | $1,088,000 | 30-Sep-2019 | 1997 | 03-Oct-2019 | 2,383 | $444 | |
| 1420 EIGHTH AVENUE | $1,210,000 | $1,238,000 | -2.26 | $1,250,000 | 30-Sep-2019 | 1931 | 08-Oct-2019 | 3,262 | $370 | |
| 255 SANDRINGHAM AVENUE | $997,500 | $1,024,600 | -2.64 | $1,038,000 | 12-Sep-2019 | 1948 | 08-Oct-2019 | 2,000 | $498 | Renovated/updated. |
| 236 HOWES STREET | $1,453,230 | $868,000 | 67.42 | $1,599,800 | 29-Mar-2019 | 2018 | 08-Oct-2019 | 2,961 | $490 | |
| 413 SCHOOL STREET | $910,000 | $997,700 | -8.79 | $940,000 | 02-Oct-2019 | 1940 | 08-Oct-2019 | 1,728 | $526 | |
| 319 QUEENS AVENUE | $1,075,000 | $1,392,700 | -22.81 | $1,098,000 | 25-Sep-2019 | 1893 | 09-Oct-2019 | 1,999 | $537 | |
| 2126 LONDON STREET | $1,524,000 | $1,776,000 | -14.19 | $1,750,000 | 21-Aug-2019 | 2012 | 09-Oct-2019 | 3,608 | $422 | |
| 316 BLACKMAN STREET | $1,084,000 | $1,039,200 | 4.31 | $1,250,000 | 20-Aug-2019 | 1953 | 11-Oct-2019 | 2,472 | $438 | Renovated/updated. |
| 826 JACKSON CRESCENT | $1,825,000 | $1,661,000 | 9.87 | $1,898,000 | 09-Oct-2019 | 1959 | 11-Oct-2019 | 4,334 | $421 | |
| 116 SECOND STREET | $1,395,000 | $1,555,000 | -10.29 | $1,589,000 | 23-May-2019 | 1963 | 13-Oct-2019 | 2,923 | $477 | Renovated/updated. |
| 116 HARVEY STREET | $1,050,000 | $1,009,800 | 3.98 | $999,900 | 08-Oct-2019 | 1930 | 15-Oct-2019 | 2,411 | $435 | Renovated/updated. |
| 406 CUMBERLAND STREET | $1,125,000 | $1,251,000 | -10.07 | $1,200,000 | 05-Oct-2019 | 1984 | 18-Oct-2019 | 3,158 | $356 | |
| 219 SECOND STREET | $1,350,000 | $1,654,000 | -18.38 | $1,350,000 | 17-Oct-2019 | 1941 | 22-Oct-2019 | 2,827 | $477 |
9 out of 15 sold below assessed with a median sold price of -2.64
North Vancouver
| Address | Sold Price | Assessed | % Δ | True List Price | True List Date | Year Built | Sold Date | Sqft | Price per sqft | Notes |
|---|---|---|---|---|---|---|---|---|---|---|
| 4633 MOUNTAIN HIGHWAY | $1,498,500 | $1,539,000 | -2.63 | $1,648,000 | 10-Jun-2019 | 1975 | 01-Oct-2019 | 2,699 | $555 | |
| 915 CLEMENTS AVENUE | $1,540,000 | $1,712,100 | -10.05 | $1,688,000 | 16-Sep-2019 | 1967 | 02-Oct-2019 | 2,844 | $541 | Renovated/updated. |
| 3450 INSTITUTE ROAD | $1,240,000 | $1,227,700 | 1.00 | $1,325,000 | 20-Jun-2019 | 1920 | 02-Oct-2019 | 1,578 | $785 | |
| 4724 PHEASANT PLACE | $2,625,000 | $3,004,000 | -12.62 | $3,488,000 | 21-Nov-2018 | 2015 | 02-Oct-2019 | 4,639 | $565 | |
| 485 MONTERAY AVENUE | $1,938,000 | $2,084,000 | -7.01 | $1,988,000 | 27-Sep-2019 | 1954 | 02-Oct-2019 | 2,755 | $703 | Renovated/updated. |
| 1205 EASTVIEW ROAD | $1,310,000 | $1,417,500 | -7.58 | $1,299,000 | 30-Sep-2019 | 1966 | 02-Oct-2019 | 2,132 | $614 | |
| 2244 W KEITH ROAD | $1,375,000 | $1,508,000 | -8.82 | $1,639,000 | 01-May-2019 | 1968 | 05-Oct-2019 | 1,145 | $1,200 | Renovated/updated. |
| 3687 CAMPBELL AVENUE | $1,326,000 | $1,548,000 | -14.34 | $1,550,000 | 11-Jun-2019 | 1955 | 05-Oct-2019 | 1,971 | $672 | Renovated/updated. |
| 782 MONTROYAL BOULEVARD | $2,950,000 | $2,720,000 | 8.46 | $3,495,000 | 06-May-2019 | 2018 | 05-Oct-2019 | 4,705 | $626 | |
| 790 GRANTHAM PLACE | $2,800,000 | $2,111,000 | 32.64 | $2,995,000 | 30-Sep-2019 | 1945 | 06-Oct-2019 | 3,240 | $864 | |
| 250 W ROCKLAND ROAD | $1,780,000 | $1,838,000 | -3.16 | $2,150,000 | 09-Aug-2018 | 1968 | 06-Oct-2019 | 3,233 | $550 | Renovated/updated. |
| 3940 RUBY AVENUE | $1,680,000 | $2,031,000 | -17.28 | $1,948,000 | 30-Jan-2019 | 1954 | 07-Oct-2019 | 2,692 | $624 | Renovated/updated. |
| 1415 ROSS ROAD | $1,500,000 | $1,481,000 | 1.28 | $1,398,000 | 01-Oct-2019 | 1963 | 07-Oct-2019 | 2,463 | $609 | Renovated/updated. |
| 2070 BOWSER AVENUE | $1,330,000 | $1,294,000 | 2.78 | $1,428,000 | 29-Jul-2019 | 1983 | 08-Oct-2019 | 2,825 | $470 | Renovated/updated. |
| 4717 PROSPECT ROAD | $2,400,000 | $1,594,000 | 50.56 | $2,599,000 | 19-Sep-2019 | 1969 | 08-Oct-2019 | 3,682 | $651 | |
| 361 E 24TH STREET | $1,290,000 | $1,538,400 | -16.15 | $1,499,900 | 09-Sep-2019 | 1959 | 09-Oct-2019 | 2,081 | $619 | |
| 697 RIVERSIDE DRIVE | $1,398,000 | $1,354,000 | 3.25 | $1,398,000 | 02-Oct-2019 | 2000 | 09-Oct-2019 | 1,789 | $781 | |
| 4759 MOUNTAIN HIGHWAY | $1,250,000 | $1,404,000 | -10.97 | $1,279,000 | 26-Sep-2019 | 1978 | 09-Oct-2019 | 1,824 | $685 | |
| 4778 HOSKINS ROAD | $1,506,000 | $1,499,000 | 0.47 | $1,499,000 | 07-Oct-2019 | 1972 | 11-Oct-2019 | 2,521 | $597 | Renovated/updated. |
| 2076 RIVERSIDE DRIVE | $1,600,000 | $1,426,000 | 12.20 | $1,698,000 | 12-Aug-2019 | 1972 | 12-Oct-2019 | 1,889 | $847 | Renovated/updated. |
| 4657 MOUNTAIN HIGHWAY | $1,470,000 | $1,543,000 | -4.73 | $1,498,000 | 13-Sep-2019 | 1972 | 13-Oct-2019 | 1,719 | $855 | Renovated/updated. |
| 1810 RIVERSIDE DRIVE | $1,465,000 | $1,501,000 | -2.40 | $1,479,000 | 23-Jan-2019 | 1973 | 13-Oct-2019 | 2,612 | $560 | Renovated/updated. |
| 3968 ST. PAULS AVENUE | $3,375,000 | $3,724,000 | -9.37 | $5,280,000 | 09-Nov-2017 | 2014 | 13-Oct-2019 | 5,711 | $590 | |
| 2862 TEMPE GLEN DRIVE | $1,420,000 | $1,589,000 | -10.64 | $1,699,800 | 13-Jun-2018 | 1989 | 14-Oct-2019 | 2,957 | $480 | |
| 705 BLYTHWOOD DRIVE | $1,500,000 | $1,615,800 | -7.17 | $1,769,500 | 06-Dec-2018 | 1958 | 15-Oct-2019 | 2,578 | $581 | Renovated/updated. |
| 677 N DOLLARTON HIGHWAY | $1,912,500 | $1,523,000 | 25.57 | $1,998,000 | 24-Sep-2019 | 1971 | 15-Oct-2019 | 2,940 | $650 | Renovated/updated. |
| 3200 BEWICKE AVENUE | $1,700,000 | $1,808,900 | -6.02 | $1,980,000 | 20-Jun-2019 | 1954 | 15-Oct-2019 | 2,138 | $795 | |
| 4158 MT SEYMOUR PARKWAY | $1,217,500 | $1,215,000 | 0.21 | $1,348,000 | 08-Jul-2019 | 1971 | 15-Oct-2019 | 1,814 | $671 | Renovated/updated. |
| 1192 SHAVINGTON STREET | $920,000 | $1,250,800 | -26.45 | $1,049,000 | 05-Oct-2019 | 1953 | 15-Oct-2019 | 1,800 | $511 | |
| 4071 SUNSET BOULEVARD | $2,300,000 | $2,660,400 | -13.55 | $2,439,000 | 14-Oct-2019 | 1952 | 16-Oct-2019 | 3,570 | $644 | Renovated/updated. |
| 3750 ST. PAULS AVENUE | $2,100,000 | $2,389,000 | -12.10 | $2,598,000 | 04-Sep-2019 | 1996 | 16-Oct-2019 | 4,403 | $476 | |
| 1020 BURNS ROAD | $1,500,000 | $1,761,000 | -14.82 | $1,549,000 | 15-Oct-2019 | 1992 | 16-Oct-2019 | 3,359 | $446 | Renovated/updated. |
| 658 ALPINE COURT | $2,900,000 | $3,210,000 | -9.66 | $3,980,000 | 29-May-2017 | 2015 | 16-Oct-2019 | 5,038 | $575 | |
| 878 E 16TH STREET | $1,575,000 | $1,602,400 | -1.71 | $1,549,000 | 11-Oct-2019 | 1966 | 16-Oct-2019 | 2,100 | $750 | |
| 4039 VIOLET STREET | $1,570,000 | $1,590,000 | -1.26 | $1,620,000 | 17-Sep-2019 | 1980 | 17-Oct-2019 | 2,765 | $567 | Renovated/updated. |
| 1226 CHAMBERLAIN DRIVE | $1,725,000 | $1,680,000 | 2.68 | $1,695,000 | 15-Oct-2019 | 1967 | 18-Oct-2019 | 2,333 | $739 | Renovated/updated. |
| 1221 SHAVINGTON STREET | $980,000 | $1,248,000 | -21.47 | $1,089,000 | 03-Oct-2019 | 1950 | 18-Oct-2019 | 2,195 | $446 | Renovated/updated. |
| 529 E 20TH STREET | $1,690,000 | $1,575,000 | 7.30 | $1,725,000 | 23-Sep-2019 | 1963 | 20-Oct-2019 | 1,733 | $975 | Renovated/updated. |
| 1324 E 16TH STREET | $1,406,000 | $1,494,800 | -5.94 | $1,319,000 | 15-Oct-2019 | 1959 | 21-Oct-2019 | 2,627 | $535 | Renovated/updated. |
| 904 BEAUMONT DRIVE | $3,100,000 | $3,126,000 | -0.83 | $2,995,000 | 17-Oct-2019 | 2005 | 22-Oct-2019 | 5,287 | $586 | |
| 417 W 15TH STREET | $2,430,000 | $2,486,000 | -2.25 | $3,350,000 | 05-Sep-2016 | 2011 | 22-Oct-2019 | 5,447 | $446 | |
| 4175 GLENHAVEN CRESCENT | $1,520,000 | $1,547,000 | -1.75 | $1,588,000 | 18-Sep-2019 | 1971 | 25-Oct-2019 | 2,784 | $545 |
29 out of 42 sold below assessed with a median sold price of -3.94
Delta
| Address | Sold Price | Assessed | % Δ | True List Price | True List Date | Year Built | Sold Date | Sqft | Price per sqft | Notes |
|---|---|---|---|---|---|---|---|---|---|---|
| 9192 119A STREET | $808,000 | $788,300 | 2.50 | $875,000 | 31-Aug-2019 | 1969 | 01-Oct-2019 | 1,953 | $413 | Renovated/updated. |
| 10580 SANTA MONICA DRIVE | $749,000 | $836,300 | -10.44 | $898,500 | 17-May-2018 | 1973 | 03-Oct-2019 | 2,232 | $335 | Renovated/updated. |
| 6291 BEECHWOOD STREET | $1,000,000 | $1,129,000 | -11.43 | $1,048,000 | 24-Jun-2019 | 1984 | 03-Oct-2019 | 2,200 | $454 | |
| 11721 79A AVENUE | $1,020,000 | $955,700 | 6.73 | $1,224,800 | 09-Sep-2016 | 1966 | 03-Oct-2019 | 2,352 | $433 | |
| 11663 89A AVENUE | $870,000 | $904,100 | -3.77 | $975,000 | 06-Jun-2018 | 1976 | 05-Oct-2019 | 2,142 | $406 | Renovated/updated. |
| 11034 83 AVENUE | $800,000 | $837,800 | -4.51 | $799,900 | 30-Sep-2019 | 1973 | 06-Oct-2019 | 2,001 | $399 | |
| 4936 44A AVENUE | $957,000 | $980,200 | -2.37 | $999,000 | 10-Jul-2019 | 1968 | 07-Oct-2019 | 3,088 | $309 | Renovated/updated. |
| 10587 HARROGATE DRIVE | $1,080,000 | $1,030,000 | 4.85 | $1,149,900 | 17-Sep-2019 | 1988 | 07-Oct-2019 | 3,823 | $282 | Renovated/updated. |
| 6370 SUNWOOD DRIVE | $1,070,000 | $1,186,000 | -9.78 | $1,098,000 | 30-Sep-2019 | 1985 | 07-Oct-2019 | 2,198 | $486 | Renovated/updated. |
| 11113 UPPER CANYON ROAD | $1,013,700 | $1,176,000 | -13.80 | $1,069,000 | 22-Aug-2019 | 1988 | 07-Oct-2019 | 3,518 | $288 | Renovated/updated. |
| 5479 WILDWOOD CRESCENT | $878,000 | $1,039,900 | -15.57 | $898,800 | 13-Sep-2019 | 1976 | 07-Oct-2019 | 1,572 | $558 | |
| 1720 DUNCAN DRIVE | $1,730,000 | $1,380,000 | 25.36 | $1,998,000 | 16-Jul-2019 | 2013 | 07-Oct-2019 | 2,621 | $660 | |
| 11808 80A AVENUE | $888,000 | $957,400 | -7.25 | $939,900 | 22-May-2019 | 1979 | 08-Oct-2019 | 1,793 | $495 | Renovated/updated. |
| 9179 118A STREET | $810,000 | $890,000 | -8.99 | $879,888 | 03-Jun-2019 | 1977 | 09-Oct-2019 | 2,078 | $389 | Renovated/updated. |
| 4586 KENSINGTON COURT | $990,000 | $971,000 | 1.96 | $999,900 | 17-Sep-2019 | 1990 | 09-Oct-2019 | 2,914 | $339 | |
| 8121 WILTSHIRE BOULEVARD | $1,072,000 | $1,081,900 | -0.92 | $1,098,000 | 23-Sep-2019 | 1973 | 09-Oct-2019 | 2,453 | $437 | Renovated/updated. |
| 4399 48B STREET | $790,000 | $959,300 | -17.65 | $825,000 | 16-Sep-2019 | 1969 | 10-Oct-2019 | 1,242 | $636 | Renovated/updated. |
| 5257 BELAIR CRESCENT | $860,000 | $1,141,600 | -24.67 | $1,288,000 | 16-Oct-2017 | 1969 | 11-Oct-2019 | 1,675 | $513 | Renovated/updated. |
| 6612 BAKER ROAD | $828,000 | $815,700 | 1.51 | $810,000 | 25-Sep-2019 | 1978 | 11-Oct-2019 | 1,775 | $466 | Renovated/updated. |
| 1578 DUNCAN DRIVE | $1,115,000 | $949,700 | 17.41 | $1,259,000 | 10-Sep-2018 | 1972 | 12-Oct-2019 | 1,322 | $843 | |
| 5415 WESTMINSTER AVENUE | $1,650,000 | $1,494,000 | 10.44 | $1,698,800 | 12-Aug-2019 | 2017 | 12-Oct-2019 | 3,546 | $465 | |
| 7958 116 STREET | $855,000 | $834,100 | 2.51 | $899,000 | 28-Aug-2019 | 1973 | 13-Oct-2019 | 2,000 | $427 | Renovated/updated. |
| 5507 SWIFTSURE BAY | $670,000 | $684,100 | -2.06 | $699,000 | 07-Aug-2019 | 1989 | 13-Oct-2019 | 1,328 | $504 | |
| 11704 74 AVENUE | $835,000 | $724,500 | 15.25 | $835,000 | 15-Oct-2019 | 1985 | 16-Oct-2019 | 2,355 | $354 | Renovated/updated. |
| 5846 17A AVENUE | $725,000 | $773,500 | -6.27 | $889,900 | 13-Feb-2019 | 1974 | 16-Oct-2019 | 1,838 | $394 | Renovated/updated. |
| 11645 87A AVENUE | $831,800 | $848,600 | -1.98 | $699,000 | 15-Oct-2019 | 1969 | 17-Oct-2019 | 1,821 | $456 | |
| 1073 SHAMAN CRESCENT | $1,198,000 | $1,407,000 | -14.85 | $1,788,000 | 26-Jul-2016 | 1967 | 17-Oct-2019 | 3,016 | $397 | Renovated/updated. |
| 5111 CENTRAL AVENUE | $840,000 | $1,066,000 | -21.20 | $949,000 | 19-Aug-2019 | 1990 | 17-Oct-2019 | 1,803 | $465 | Renovated/updated. |
| 4905 6 AVENUE | $1,016,500 | $1,140,900 | -10.90 | $1,180,000 | 24-Jun-2019 | 1967 | 17-Oct-2019 | 2,100 | $484 | Renovated/updated. |
| 4851 ELLIS LANE | $895,000 | $750,000 | 19.33 | $1,048,000 | 03-Apr-2018 | 2017 | 17-Oct-2019 | 1,877 | $476 | |
| 11898 74B AVENUE | $827,500 | $850,900 | -2.75 | $899,800 | 06-Jun-2018 | 1970 | 19-Oct-2019 | 1,210 | $683 | |
| 11685 79A AVENUE | $750,000 | $876,100 | -14.39 | $849,000 | 02-Jul-2019 | 1979 | 20-Oct-2019 | 1,390 | $539 | |
| 7014 ALPINE PLACE | $1,385,000 | $1,223,100 | 13.24 | $1,398,000 | 14-Oct-2019 | 1979 | 21-Oct-2019 | 2,976 | $465 | Renovated/updated. |
| 7851 114A STREET | $805,000 | $902,700 | -10.82 | $898,000 | 21-Nov-2018 | 1972 | 21-Oct-2019 | 2,037 | $395 | Renovated/updated. |
| 5209 SCHOONER GATE | $540,000 | $638,000 | -15.36 | $619,000 | 01-May-2019 | 1987 | 22-Oct-2019 | 1,206 | $447 | |
| 5178 WESTMINSTER LANE | $998,000 | $1,061,000 | -5.94 | $998,000 | 21-Oct-2019 | 2008 | 23-Oct-2019 | 2,190 | $455 | Renovated/updated. |
| 1159 JACKSON WAY | $1,280,000 | $1,284,800 | -0.37 | $1,699,000 | 25-Jul-2018 | 1967 | 23-Oct-2019 | 2,643 | $484 | Renovated/updated. |
25 out of 37 sold below assessed with a median sold price of -3.77
Surrey
| Address | Sold Price | Assessed | % Δ | True List Price | True List Date | Year Built | Sold Date | Sqft | Price per sqft | Notes |
|---|---|---|---|---|---|---|---|---|---|---|
| 6517 142A STREET | $970,000 | $1,009,000 | -3.87 | $1,199,000 | 28-Mar-2018 | 2008 | 01-Oct-2019 | 2,230 | $434 | |
| 6121 134A STREET | $950,000 | $1,040,000 | -8.65 | $975,000 | 16-Sep-2019 | 1987 | 01-Oct-2019 | 2,307 | $411 | Renovated/updated. |
| 2335 150 STREET | $1,350,000 | $1,399,000 | -3.50 | $1,399,900 | 03-Sep-2019 | 2002 | 01-Oct-2019 | 2,615 | $516 | Renovated/updated. |
| 10095 121A STREET | $795,000 | $769,400 | 3.33 | $799,000 | 30-Sep-2019 | 1958 | 01-Oct-2019 | 2,510 | $316 | |
| 18356 66 AVENUE | $960,000 | $1,034,000 | -7.16 | $998,000 | 06-Aug-2019 | 1998 | 01-Oct-2019 | 2,413 | $397 | |
| 5954 133 STREET | $950,000 | $943,700 | 0.67 | $888,000 | 26-Apr-2018 | 1988 | 01-Oct-2019 | 2,647 | $358 | |
| 1515 133B STREET | $1,065,000 | $1,192,000 | -10.65 | $1,429,900 | 11-Nov-2017 | 1979 | 01-Oct-2019 | 2,694 | $395 | Renovated/updated. |
| 12867 CARLUKE CRESCENT | $1,800,000 | $1,732,000 | 3.93 | $1,849,800 | 03-Jul-2019 | 2016 | 01-Oct-2019 | 5,875 | $306 | |
| 84 1400 164 STREET | $480,000 | $486,600 | -1.36 | $515,000 | 15-Sep-2019 | 1987 | 01-Oct-2019 | 1,007 | $476 | Renovated/updated. |
| 13281 AMBLE GREENE PLACE | $1,300,000 | $1,419,000 | -8.39 | $1,988,000 | 01-Nov-2017 | 1985 | 01-Oct-2019 | 2,236 | $581 | Renovated/updated. |
| 17451 2B AVENUE | $980,000 | $991,000 | -1.11 | $999,000 | 03-Sep-2019 | 2014 | 01-Oct-2019 | 2,520 | $388 | |
| 12467 61A AVENUE | $1,220,000 | $1,086,000 | 12.34 | $1,249,900 | 18-Sep-2019 | 1988 | 02-Oct-2019 | 2,503 | $487 | Renovated/updated. |
| 9699 155 STREET | $770,000 | $791,700 | -2.74 | $799,900 | 17-Sep-2019 | 1981 | 02-Oct-2019 | 2,069 | $372 | |
| 1061 165 STREET | $890,000 | $1,008,600 | -11.76 | $899,998 | 23-Sep-2019 | 1987 | 02-Oct-2019 | 1,660 | $536 | |
| 18178 67 AVENUE | $859,000 | $888,000 | -3.27 | $849,800 | 02-Oct-2019 | 2003 | 02-Oct-2019 | 2,791 | $307 | |
| 9972 157 STREET | $834,000 | $926,000 | -9.94 | $830,000 | 10-Sep-2019 | 1982 | 02-Oct-2019 | 2,889 | $288 | |
| 10882 145A STREET | $920,000 | $866,300 | 6.20 | $925,000 | 14-Aug-2019 | 1964 | 02-Oct-2019 | 2,628 | $350 | |
| 9076 160A STREET | $961,000 | $955,000 | 0.63 | $989,000 | 25-Sep-2019 | 1990 | 02-Oct-2019 | 2,154 | $446 | Renovated/updated. |
| 14272 61A AVENUE | $1,088,000 | $1,088,000 | 0.00 | $1,139,000 | 13-May-2019 | 2012 | 02-Oct-2019 | 2,998 | $362 | |
| 11309 162 STREET | $1,682,000 | $1,698,000 | -0.94 | $1,928,000 | 02-Apr-2019 | 2001 | 03-Oct-2019 | 5,264 | $319 | Renovated/updated. |
| 5728 123 STREET | $1,780,000 | $2,048,000 | -13.09 | $1,889,000 | 15-May-2019 | 1998 | 03-Oct-2019 | 4,167 | $427 | |
| 13345 55A AVENUE | $1,478,000 | $2,115,000 | -30.12 | $2,680,000 | 17-Dec-2015 | 1993 | 03-Oct-2019 | 4,831 | $305 | |
| 14250 72A AVENUE | $818,000 | $800,300 | 2.21 | $849,000 | 29-Aug-2019 | 1980 | 03-Oct-2019 | 1,890 | $432 | |
| 10566 168 STREET | $1,060,000 | $1,117,000 | -5.10 | $1,199,000 | 06-Aug-2019 | 1992 | 03-Oct-2019 | 2,950 | $359 | |
| 10675 EASTGLEN PLACE | $1,230,000 | $1,212,000 | 1.49 | $1,290,000 | 18-Jul-2019 | 1995 | 03-Oct-2019 | 3,282 | $374 | |
| 6283 175A STREET | $883,500 | $896,900 | -1.49 | $888,900 | 03-Oct-2019 | 1981 | 03-Oct-2019 | 2,178 | $405 | |
| 12073 84A AVENUE | $725,000 | $930,800 | -22.11 | $849,000 | 16-Aug-2019 | 1989 | 04-Oct-2019 | 1,501 | $483 | |
| 6077 146 STREET | $1,060,000 | $1,078,000 | -1.67 | $1,190,000 | 01-Jul-2019 | 2009 | 04-Oct-2019 | 3,124 | $339 | |
| 15667 93A AVENUE | $870,000 | $891,300 | -2.39 | $999,800 | 11-Jun-2018 | 1987 | 04-Oct-2019 | 1,751 | $496 | Renovated/updated. |
| 14607 60 AVENUE | $903,000 | $985,000 | -8.32 | $988,800 | 25-Jun-2019 | 2007 | 04-Oct-2019 | 2,511 | $359 | |
| 6795 128B STREET | $733,000 | $674,200 | 8.72 | $759,000 | 09-Sep-2019 | 1978 | 04-Oct-2019 | 1,600 | $458 | |
| 1446 128 STREET | $925,000 | $904,100 | 2.31 | $1,075,000 | 03-May-2019 | 1972 | 04-Oct-2019 | 1,622 | $570 | |
| 6245 146A STREET | $1,132,000 | $1,166,000 | -2.92 | $1,349,000 | 02-Aug-2018 | 2011 | 04-Oct-2019 | 4,035 | $280 | |
| 13258 67 AVENUE | $745,000 | $746,300 | -0.17 | $779,000 | 12-Sep-2019 | 1979 | 04-Oct-2019 | 1,603 | $464 | Renovated/updated. |
| 3396 164A STREET | $3,080,000 | $2,708,000 | 13.74 | $4,688,000 | 22-Jun-2018 | 2015 | 04-Oct-2019 | 6,951 | $443 | |
| 13141 14A AVENUE | $1,500,000 | $1,500,000 | 0.00 | $2,180,000 | 08-Jan-2018 | 1990 | 04-Oct-2019 | 2,468 | $607 | Renovated/updated. |
| 12365 S BOUNDARY DRIVE | $1,145,000 | $1,190,000 | -3.78 | $1,199,000 | 26-Sep-2019 | 1987 | 04-Oct-2019 | 2,868 | $399 | |
| 14588 88A AVENUE | $1,389,000 | $1,379,000 | 0.73 | $1,699,000 | 01-May-2018 | 2014 | 05-Oct-2019 | 4,485 | $309 | |
| 15405 93 AVENUE | $762,000 | $886,300 | -14.02 | $839,900 | 28-Aug-2019 | 1987 | 05-Oct-2019 | 1,500 | $508 | |
| 9066 156 STREET | $820,000 | $846,100 | -3.08 | $979,800 | 18-Apr-2018 | 1960 | 05-Oct-2019 | 2,456 | $333 | Renovated/updated. |
| 9758 157 STREET | $1,075,000 | $892,200 | 20.49 | $1,099,000 | 20-Sep-2019 | 1982 | 05-Oct-2019 | 2,870 | $374 | Renovated/updated. |
| 12625 CENTRE DRIVE | $897,000 | $736,500 | 21.79 | $979,000 | 04-Sep-2019 | 1956 | 05-Oct-2019 | 1,800 | $498 | |
| 5851 185A STREET | $905,000 | $852,100 | 6.21 | $949,900 | 05-Jun-2019 | 1988 | 05-Oct-2019 | 2,325 | $389 | Renovated/updated. |
| 8234 156 STREET | $1,090,000 | $1,205,000 | -9.54 | $1,325,000 | 27-Jun-2017 | 1998 | 05-Oct-2019 | 3,327 | $327 | Renovated/updated. |
| 10079 171A STREET | $1,118,000 | $1,105,000 | 1.18 | $1,250,000 | 03-Jul-2018 | 1992 | 05-Oct-2019 | 2,428 | $460 | Renovated/updated. |
| 9288 149A STREET | $890,000 | $907,000 | -1.87 | $928,890 | 06-Jun-2019 | 1978 | 05-Oct-2019 | 2,650 | $335 | |
| 14929 35A AVENUE | $1,409,520 | $825,000 | 70.85 | $1,558,000 | 12-Jun-2019 | 2018 | 05-Oct-2019 | 3,617 | $389 | |
| 12472 100 AVENUE | $930,000 | $841,600 | 10.50 | $975,000 | 13-Jun-2019 | 1964 | 06-Oct-2019 | 2,540 | $366 | |
| 13537 67A AVENUE | $800,000 | $915,400 | -12.61 | $868,000 | 20-May-2019 | 1958 | 06-Oct-2019 | 1,125 | $711 | |
| 18252 59A AVENUE | $785,000 | $843,300 | -6.91 | $849,900 | 26-Jun-2019 | 1978 | 06-Oct-2019 | 2,046 | $383 | |
| 14752 84A AVENUE | $920,000 | $892,000 | 3.14 | $1,149,000 | 27-Feb-2019 | 1990 | 06-Oct-2019 | 3,073 | $299 | |
| 6040 172A STREET | $880,000 | $890,600 | -1.19 | $899,000 | 02-Oct-2019 | 1978 | 06-Oct-2019 | 2,040 | $431 | |
| 6148 166A STREET | $1,050,000 | $1,096,000 | -4.20 | $1,100,000 | 11-Jul-2019 | 2001 | 06-Oct-2019 | 3,345 | $313 | |
| 12924 69A AVENUE | $905,000 | $977,000 | -7.37 | $959,500 | 02-Oct-2019 | 1986 | 06-Oct-2019 | 2,000 | $452 | |
| 14911 76A AVENUE | $1,340,000 | $1,281,000 | 4.61 | $1,349,800 | 10-Sep-2019 | 2007 | 06-Oct-2019 | 4,715 | $284 | |
| 18036 70A AVENUE | $845,000 | $911,000 | -7.24 | $859,000 | 04-Oct-2019 | 2007 | 06-Oct-2019 | 2,436 | $346 | Renovated/updated. |
| 17799 59 AVENUE | $710,000 | $785,600 | -9.62 | $799,000 | 20-Aug-2019 | 1959 | 06-Oct-2019 | 902 | $787 | |
| 2276 130 STREET | $1,655,000 | $1,871,000 | -11.54 | $1,564,800 | 01-Oct-2019 | 1987 | 06-Oct-2019 | 2,876 | $575 | |
| 13547 67A AVENUE | $800,000 | $917,300 | -12.79 | $880,000 | 04-Jul-2019 | 1959 | 07-Oct-2019 | 900 | $888 | |
| 15029 86 AVENUE | $841,000 | $838,600 | 0.29 | $889,000 | 22-Mar-2019 | 1976 | 07-Oct-2019 | 1,644 | $511 | |
| 8180 153 STREET | $1,145,000 | $1,195,000 | -4.18 | $1,179,000 | 08-Aug-2019 | 1998 | 07-Oct-2019 | 3,100 | $369 | Renovated/updated. |
| 10451 125 STREET | $1,195,000 | $1,089,000 | 9.73 | $1,111,000 | 03-Feb-2017 | 2012 | 07-Oct-2019 | 4,256 | $280 | |
| 6672 195 STREET | $990,000 | $935,000 | 5.88 | $988,888 | 07-Oct-2019 | 2006 | 08-Oct-2019 | 2,741 | $361 | |
| 6765 129 STREET | $750,000 | $817,400 | -8.25 | $779,000 | 25-Jul-2019 | 1983 | 08-Oct-2019 | 1,706 | $439 | Renovated/updated. |
| 70 172 STREET | $1,190,000 | $995,000 | 19.60 | $1,230,000 | 10-Sep-2019 | 2010 | 08-Oct-2019 | 3,147 | $378 | |
| 12547 19 AVENUE | $1,432,500 | $1,335,000 | 7.30 | $1,599,000 | 06-Aug-2019 | 1991 | 08-Oct-2019 | 3,511 | $408 | Renovated/updated. |
| 6186 164A STREET | $1,160,000 | $1,168,000 | -0.68 | $1,229,000 | 11-Sep-2019 | 2005 | 08-Oct-2019 | 4,237 | $273 | |
| 3149 147 STREET | $1,400,000 | $1,458,000 | -3.98 | $1,748,000 | 23-Jul-2018 | 1998 | 08-Oct-2019 | 4,046 | $346 | Renovated/updated. |
| 16822 61 AVENUE | $1,260,000 | $751,300 | 67.71 | $1,349,000 | 29-May-2019 | 2018 | 08-Oct-2019 | 2,988 | $421 | |
| 1710 143B STREET | $1,016,000 | $1,106,000 | -8.14 | $1,250,000 | 03-Jul-2018 | 1980 | 09-Oct-2019 | 1,496 | $679 | |
| 14321 HAWKSTREAM DRIVE | $1,102,000 | $1,105,000 | -0.27 | $1,069,000 | 07-Oct-2019 | 1997 | 10-Oct-2019 | 4,157 | $265 | |
| 6559 129A STREET | $860,000 | $842,600 | 2.07 | $999,999 | 28-Jun-2019 | 1980 | 10-Oct-2019 | 2,062 | $417 | |
| 9009 PRINCE CHARLES BOULEVARD | $861,800 | $882,000 | -2.29 | $788,000 | 07-Oct-2019 | 1971 | 10-Oct-2019 | 1,830 | $470 | |
| 15310 96 AVENUE | $1,149,000 | $1,089,000 | 5.51 | $1,169,000 | 07-Oct-2019 | 2003 | 10-Oct-2019 | 3,814 | $301 | |
| 9080 161A STREET | $908,500 | $926,000 | -1.89 | $999,800 | 06-Jun-2018 | 1989 | 10-Oct-2019 | 2,000 | $454 | |
| 14257 61A AVENUE | $1,113,000 | $1,095,000 | 1.64 | $1,199,800 | 25-Jul-2018 | 2012 | 11-Oct-2019 | 3,198 | $348 | |
| 12217 SULLIVAN STREET | $968,000 | $1,218,700 | -20.57 | $1,379,000 | 11-Mar-2019 | 1943 | 11-Oct-2019 | 1,563 | $619 | |
| 14134 72 AVENUE | $865,000 | $768,900 | 12.50 | $949,800 | 19-Aug-2019 | 1974 | 12-Oct-2019 | 2,188 | $395 | Renovated/updated. |
| 13279 65A AVENUE | $736,000 | $764,800 | -3.77 | $799,000 | 08-Jul-2019 | 1981 | 12-Oct-2019 | 1,444 | $509 | |
| 9682 PRINCESS DRIVE | $865,000 | $946,000 | -8.56 | $879,900 | 11-Sep-2019 | 1959 | 12-Oct-2019 | 2,650 | $326 | Renovated/updated. |
| 16372 25 AVENUE | $1,600,000 | $1,592,000 | 0.50 | $1,799,000 | 20-Sep-2019 | 2010 | 12-Oct-2019 | 3,692 | $433 | |
| 14324 68A AVENUE | $850,000 | $881,600 | -3.58 | $850,000 | 26-Sep-2019 | 1984 | 13-Oct-2019 | 1,710 | $497 | |
| 12848 93 AVENUE | $1,450,000 | $1,290,000 | 12.40 | $1,525,000 | 08-Jul-2019 | 2011 | 13-Oct-2019 | 4,329 | $334 | |
| 15015 BLUEBIRD CRESCENT | $764,000 | $793,100 | -3.67 | $779,385 | 25-Sep-2019 | 1960 | 13-Oct-2019 | 1,815 | $420 | Renovated/updated. |
| 6724 145A STREET | $991,000 | $1,052,000 | -5.80 | $999,000 | 14-Jun-2019 | 2003 | 13-Oct-2019 | 2,485 | $398 | |
| 6482 131 STREET | $820,000 | $852,600 | -3.82 | $849,500 | 25-Jan-2017 | 1979 | 13-Oct-2019 | 2,222 | $369 | |
| 16556 60A AVENUE | $842,500 | $866,000 | -2.71 | $928,800 | 05-Jul-2019 | 2006 | 13-Oct-2019 | 2,164 | $389 | |
| 14578 61A AVENUE | $1,209,520 | $753,700 | 60.48 | $1,349,900 | 09-May-2019 | 2018 | 14-Oct-2019 | 4,066 | $297 | |
| 14198 65 AVENUE | $1,032,000 | $1,031,000 | 0.10 | $1,175,000 | 23-Aug-2018 | 2001 | 15-Oct-2019 | 3,250 | $317 | Renovated/updated. |
| 14910 68 AVENUE | $1,261,000 | $1,208,000 | 4.39 | $1,275,800 | 05-Sep-2019 | 2004 | 15-Oct-2019 | 4,010 | $314 | |
| 5969 129 STREET | $945,000 | $973,000 | -2.88 | $998,000 | 26-Sep-2019 | 2011 | 15-Oct-2019 | 2,604 | $362 | |
| 13469 17 AVENUE | $1,275,000 | $1,361,000 | -6.32 | $1,880,000 | 01-Aug-2016 | 1980 | 15-Oct-2019 | 3,095 | $411 | Renovated/updated. |
| 6495 180 STREET | $961,500 | $960,000 | 0.16 | $998,000 | 14-Aug-2019 | 1989 | 15-Oct-2019 | 2,353 | $408 | |
| 17113 0A AVENUE | $1,350,000 | $996,000 | 35.54 | $875,000 | 10-Aug-2017 | 2018 | 16-Oct-2019 | 3,728 | $362 | Renovated/updated. |
| 8739 MILTON DRIVE | $765,000 | $859,800 | -11.03 | $789,888 | 17-Sep-2019 | 1976 | 16-Oct-2019 | 1,920 | $398 | |
| 12104 56 AVENUE | $1,195,000 | $1,301,400 | -8.18 | $1,490,000 | 11-Aug-2017 | 1963 | 16-Oct-2019 | 2,712 | $440 | |
| 7872 123 STREET | $901,000 | $890,400 | 1.19 | $849,900 | 14-Oct-2019 | 1958 | 16-Oct-2019 | 1,956 | $460 | |
| 16917 FRIESIAN DRIVE | $1,040,000 | $1,055,000 | -1.42 | $1,150,000 | 08-Aug-2019 | 1994 | 16-Oct-2019 | 3,896 | $266 | |
| 60 174 STREET | $1,069,000 | $1,205,000 | -11.29 | $1,288,000 | 06-Jun-2018 | 2010 | 16-Oct-2019 | 3,056 | $349 | |
| 10292 170A STREET | $1,080,000 | $1,164,000 | -7.22 | $1,269,000 | 22-Apr-2019 | 1992 | 16-Oct-2019 | 2,788 | $387 | |
| 2189 153 STREET | $872,000 | $993,700 | -12.25 | $929,900 | 19-Aug-2019 | 1985 | 17-Oct-2019 | 1,611 | $541 | |
| 12832 68A AVENUE | $959,000 | $896,500 | 6.97 | $989,000 | 02-Oct-2019 | 1982 | 17-Oct-2019 | 2,828 | $339 | |
| 12966 15A AVENUE | $1,460,000 | $1,351,000 | 8.07 | $1,858,000 | 21-Nov-2018 | 2016 | 18-Oct-2019 | 3,160 | $462 | |
| 13075 59 AVENUE | $915,000 | $945,000 | -3.17 | $949,000 | 02-Oct-2017 | 2017 | 18-Oct-2019 | 2,080 | $439 | |
| 13207 65A AVENUE | $868,000 | $800,800 | 8.39 | $949,000 | 29-Aug-2019 | 1982 | 19-Oct-2019 | 1,870 | $464 | |
| 13408 79 AVENUE | $870,000 | $895,500 | -2.85 | $889,000 | 18-Oct-2019 | 1957 | 19-Oct-2019 | 1,100 | $790 | |
| 5966 186 STREET | $937,500 | $930,000 | 0.81 | $949,900 | 19-Aug-2019 | 1992 | 19-Oct-2019 | 2,293 | $408 | Renovated/updated. |
| 19438 73 AVENUE | $960,000 | $970,000 | -1.03 | $1,050,000 | 29-May-2019 | 2015 | 20-Oct-2019 | 2,645 | $362 | |
| 10946 144 STREET | $905,000 | $918,800 | -1.50 | $880,000 | 16-Oct-2019 | 1957 | 20-Oct-2019 | 2,514 | $359 | |
| 12219 99 AVENUE | $875,000 | $856,500 | 2.16 | $889,000 | 09-Oct-2019 | 1958 | 20-Oct-2019 | 2,480 | $352 | |
| 14153 62A AVENUE | $1,080,000 | $910,000 | 18.68 | $1,149,000 | 18-Sep-2017 | 2008 | 20-Oct-2019 | 3,037 | $355 | |
| 7867 164B STREET | $1,260,000 | $1,201,000 | 4.91 | $1,399,890 | 08-Jul-2019 | 2008 | 20-Oct-2019 | 3,715 | $339 | |
| 14093 114 AVENUE | $1,306,500 | $1,432,000 | -8.76 | $489,000 | 29-Sep-2015 | 2017 | 21-Oct-2019 | 5,477 | $238 | |
| 16017 28 AVENUE | $1,300,000 | $1,182,000 | 9.98 | $1,425,000 | 27-May-2019 | 2017 | 21-Oct-2019 | 3,625 | $358 | |
| 10246 127 STREET | $790,000 | $791,100 | -0.14 | $899,900 | 30-Jul-2019 | 1955 | 21-Oct-2019 | 2,190 | $360 | |
| 19379 73B AVENUE | $1,050,000 | $1,052,000 | -0.19 | $1,085,000 | 10-Jul-2019 | 2008 | 21-Oct-2019 | 3,364 | $312 | |
| 14256 86B AVENUE | $950,000 | $954,000 | -0.42 | $989,900 | 15-Oct-2019 | 1989 | 22-Oct-2019 | 2,090 | $454 | |
| 13041 HUNTLEY AVENUE | $860,000 | $877,100 | -1.95 | $885,000 | 21-Oct-2019 | 1973 | 22-Oct-2019 | 2,003 | $429 | |
| 9058 160 STREET | $933,000 | $859,000 | 8.61 | $1,088,000 | 05-Jun-2019 | 1989 | 22-Oct-2019 | 1,908 | $488 | Renovated/updated. |
| 1878 130A STREET | $1,274,000 | $1,448,000 | -12.02 | $1,440,000 | 10-Apr-2019 | 1986 | 22-Oct-2019 | 1,820 | $700 | |
| 13175 19A AVENUE | $2,275,000 | $1,967,000 | 15.66 | $2,688,000 | 16-May-2019 | 2018 | 22-Oct-2019 | 5,829 | $390 | |
| 9769 120A STREET | $810,000 | $916,200 | -11.59 | $999,999 | 19-Jun-2019 | 1955 | 22-Oct-2019 | 2,031 | $398 | |
| 10927 155 STREET | $1,140,000 | $1,125,000 | 1.33 | $1,190,000 | 30-Sep-2019 | 1995 | 23-Oct-2019 | 3,369 | $338 | |
| 10682 155A ST STREET | $750,000 | $967,800 | -22.50 | $835,000 | 06-Nov-2018 | 1988 | 24-Oct-2019 | 1,589 | $471 |
73 out of 122 sold below assessed with a median sold price of -1.46
Port Moody
| Address | Sold Price | Assessed | % Δ | True List Price | True List Date | Year Built | Sold Date | Sqft | Price per sqft | Notes |
|---|---|---|---|---|---|---|---|---|---|---|
| 2 ASHWOOD DRIVE | $1,600,000 | $1,826,000 | -12.38 | $1,899,000 | 10-Mar-2019 | 2002 | 04-Oct-2019 | 4,177 | $383 | |
| 100 MAPLE DRIVE | $1,838,000 | $1,855,000 | -0.92 | $1,850,000 | 02-Oct-2019 | 2006 | 09-Oct-2019 | 3,723 | $493 | |
| 208 ASPENWOOD DRIVE | $1,300,000 | $1,592,000 | -18.34 | $1,500,000 | 12-Aug-2019 | 1997 | 15-Oct-2019 | 4,266 | $304 | |
| 937 GARROW DRIVE | $1,285,000 | $1,156,000 | 11.16 | $1,298,000 | 11-Oct-2019 | 1965 | 15-Oct-2019 | 2,137 | $601 | Renovated/updated. |
3 out of 4 sold below assessed with a median sold price of -6.65
Coquitlam
| Address | Sold Price | Assessed | % Δ | True List Price | True List Date | Year Built | Sold Date | Sqft | Price per sqft | Notes |
|---|---|---|---|---|---|---|---|---|---|---|
| 776 MILLER AVENUE | $1,880,000 | $1,839,000 | 2.23 | $1,099,000 | 13-Dec-2016 | 2017 | 01-Oct-2019 | 5,253 | $357 | |
| 329 MARMONT STREET | $1,040,000 | $1,276,600 | -18.53 | $1,128,800 | 17-Apr-2019 | 1944 | 01-Oct-2019 | 2,244 | $463 | |
| 839 REDDINGTON COURT | $1,070,000 | $1,135,000 | -5.73 | $999,900 | 23-Sep-2019 | 1980 | 02-Oct-2019 | 2,915 | $367 | Renovated/updated. |
| 814 GREENE STREET | $945,000 | $932,000 | 1.39 | $900,000 | 16-Sep-2019 | 1977 | 02-Oct-2019 | 2,400 | $393 | Renovated/updated. |
| 134 MONTGOMERY STREET | $1,085,000 | $1,102,000 | -1.54 | $1,249,000 | 26-Mar-2019 | 1967 | 02-Oct-2019 | 2,751 | $394 | |
| 3423 GISLASON AVENUE | $1,238,000 | $1,313,000 | -5.71 | $1,349,900 | 24-May-2019 | 2010 | 02-Oct-2019 | 3,240 | $382 | |
| 2870 MCLAREN COURT | $1,639,900 | $1,612,000 | 1.73 | $1,888,000 | 09-Apr-2019 | 2005 | 03-Oct-2019 | 4,267 | $384 | |
| 1530 MILFORD AVENUE | $1,050,000 | $1,228,000 | -14.50 | $1,128,000 | 30-Sep-2019 | 1959 | 03-Oct-2019 | 2,165 | $484 | Renovated/updated. |
| 1389 LANSDOWNE DRIVE | $1,210,000 | $1,212,000 | -0.17 | $1,198,800 | 30-Sep-2019 | 1981 | 04-Oct-2019 | 3,300 | $366 | Renovated/updated. |
| 3010 ASHBROOK PLACE | $590,000 | $656,000 | -10.06 | $649,500 | 06-Jun-2019 | 1975 | 04-Oct-2019 | 1,328 | $444 | Renovated/updated. |
| 3385 HIGHLAND DRIVE | $1,465,000 | $941,000 | 55.69 | $1,650,000 | 08-Jul-2019 | 04-Oct-2019 | 3,927 | $373 | ||
| 3504 PRINCETON AVENUE | $1,376,000 | $1,492,000 | -7.77 | $1,428,000 | 30-May-2019 | 2014 | 04-Oct-2019 | 3,482 | $395 | |
| 3359 SCOTCH PINE AVENUE | $1,698,000 | $1,801,000 | -5.72 | $1,788,000 | 25-Jun-2019 | 2010 | 04-Oct-2019 | 4,652 | $365 | |
| 701 DANVILLE COURT | $1,027,000 | $1,250,900 | -17.90 | $1,098,000 | 01-Oct-2019 | 1959 | 04-Oct-2019 | 2,167 | $473 | Renovated/updated. |
| 2746 CULTUS AVENUE | $1,110,000 | $1,257,000 | -11.69 | $1,139,000 | 09-Sep-2019 | 1986 | 04-Oct-2019 | 3,529 | $314 | Renovated/updated. |
| 3415 GISLASON AVENUE | $1,225,000 | $1,314,000 | -6.77 | $1,309,000 | 03-Sep-2019 | 2010 | 05-Oct-2019 | 3,131 | $391 | |
| 606 THOMPSON AVENUE | $1,363,000 | $1,356,400 | 0.49 | $1,359,000 | 01-Oct-2019 | 1964 | 05-Oct-2019 | 2,196 | $620 | |
| 881 BAKER DRIVE | $1,310,000 | $1,309,700 | 0.02 | $1,448,800 | 27-May-2019 | 1966 | 06-Oct-2019 | 2,671 | $490 | Renovated/updated. |
| 1593 SALAL CRESCENT | $1,288,000 | $1,347,000 | -4.38 | $1,288,000 | 02-Oct-2019 | 1993 | 06-Oct-2019 | 3,866 | $333 | |
| 707 POPLAR STREET | $2,430,000 | $1,401,000 | 73.45 | $2,499,900 | 03-Oct-2019 | 2018 | 06-Oct-2019 | 4,967 | $489 | |
| 3488 BISHOP PLACE | $1,530,000 | $1,713,000 | -10.68 | $1,759,000 | 19-Jun-2019 | 2014 | 06-Oct-2019 | 3,829 | $399 | |
| 3545 ARCHWORTH AVENUE | $1,405,000 | $1,535,000 | -8.47 | $1,510,000 | 26-Feb-2019 | 2018 | 07-Oct-2019 | 3,492 | $402 | |
| 505 HILLCREST STREET | $1,785,000 | $1,825,000 | -2.19 | $1,999,000 | 02-Aug-2017 | 2017 | 07-Oct-2019 | 4,668 | $382 | |
| 1286 DAIMLER STREET | $979,000 | $1,099,000 | -10.92 | $998,888 | 28-Aug-2019 | 1986 | 08-Oct-2019 | 1,553 | $630 | Renovated/updated. |
| 2270 PORTAGE AVENUE | $1,005,000 | $1,145,100 | -12.23 | $1,199,900 | 17-May-2019 | 1960 | 08-Oct-2019 | 2,175 | $462 | Renovated/updated. |
| 3422 GALLOWAY AVENUE | $1,318,000 | $1,431,000 | -7.90 | $1,515,000 | 26-Mar-2019 | 2010 | 09-Oct-2019 | 3,518 | $374 | |
| 29 2865 GLEN DRIVE | $813,000 | $931,000 | -12.67 | $849,000 | 26-Jul-2019 | 1987 | 09-Oct-2019 | 1,317 | $617 | |
| 2860 SEDGE COURT | $1,350,000 | $1,460,000 | -7.53 | $1,390,000 | 27-May-2019 | 1994 | 09-Oct-2019 | 4,644 | $290 | |
| 3510 BISHOP PLACE | $1,590,000 | $1,717,000 | -7.40 | $2,150,000 | 03-Aug-2018 | 2014 | 09-Oct-2019 | 3,782 | $420 | |
| 2007 MONTEREY AVENUE | $1,043,000 | $1,224,000 | -14.79 | $1,198,000 | 15-Aug-2018 | 1947 | 10-Oct-2019 | 2,047 | $509 | Renovated/updated. |
| 1050 SMITH AVENUE | $1,248,000 | $1,436,100 | -13.10 | $1,528,000 | 30-Aug-2017 | 1961 | 10-Oct-2019 | 2,320 | $537 | Renovated/updated. |
| 1693 SHERIDAN AVENUE | $945,000 | $1,183,000 | -20.12 | $915,000 | 10-Oct-2019 | 1957 | 11-Oct-2019 | 1,211 | $780 | Renovated/updated. |
| 1286 OXFORD STREET | $1,285,000 | $1,281,000 | 0.31 | $1,348,000 | 08-Jul-2019 | 2001 | 11-Oct-2019 | 3,658 | $351 | |
| 681 EASTERBROOK STREET | $1,163,000 | $1,245,400 | -6.62 | $1,198,800 | 09-Sep-2019 | 1970 | 11-Oct-2019 | 2,242 | $518 | Renovated/updated. |
| 1720 CHARLAND AVENUE | $1,180,000 | $1,249,000 | -5.52 | $1,290,000 | 03-Oct-2019 | 1965 | 12-Oct-2019 | 2,784 | $423 | |
| 2612 ROGATE AVENUE | $963,000 | $1,133,000 | -15.00 | $999,000 | 24-Jul-2018 | 1973 | 12-Oct-2019 | 2,817 | $341 | Renovated/updated. |
| 1505 EAGLE MOUNTAIN DRIVE | $1,310,000 | $1,490,000 | -12.08 | $1,699,000 | 30-May-2018 | 1995 | 12-Oct-2019 | 3,992 | $328 | |
| 183 SAN JUAN PLACE | $1,078,000 | $1,138,000 | -5.27 | $1,290,000 | 06-Feb-2018 | 1995 | 13-Oct-2019 | 3,323 | $324 | |
| 1971 CARSON COURT | $1,100,000 | $1,309,300 | -15.99 | $1,350,000 | 29-Apr-2017 | 1972 | 15-Oct-2019 | 3,646 | $301 | Renovated/updated. |
| 2075 AUSTIN AVENUE | $925,000 | $935,600 | -1.13 | $898,000 | 22-Oct-2019 | 1964 | 28-Oct-2019 | 2,318 | $399 |
32 out of 40 sold below assessed with a median sold price of -7.08
Port Coquitlam
| Address | Sold Price | Assessed | % Δ | True List Price | True List Date | Year Built | Sold Date | Sqft | Price per sqft | Notes |
|---|---|---|---|---|---|---|---|---|---|---|
| 937 LYNWOOD AVENUE | $720,000 | $923,800 | -22.06 | $799,900 | 19-Aug-2019 | 1982 | 02-Oct-2019 | 1,461 | $492 | Renovated/updated. |
| 4020 MARS PLACE | $775,000 | $870,000 | -10.92 | $938,000 | 04-Jul-2018 | 1983 | 04-Oct-2019 | 1,758 | $440 | |
| 3446 LIVERPOOL STREET | $800,000 | $921,100 | -13.15 | $1,059,890 | 05-Feb-2019 | 1964 | 08-Oct-2019 | 2,269 | $352 | |
| 1497 CELESTE CRESCENT | $953,500 | $1,055,000 | -9.62 | $959,900 | 09-Oct-2019 | 1967 | 12-Oct-2019 | 2,475 | $385 | Renovated/updated. |
| 914 OSPREY PLACE | $905,000 | $1,027,000 | -11.88 | $949,000 | 17-Jul-2019 | 1972 | 13-Oct-2019 | 2,250 | $402 | Renovated/updated. |
| 1959 MANNING AVENUE | $810,000 | $801,700 | 1.04 | $899,900 | 15-Apr-2019 | 1919 | 21-Oct-2019 | 2,150 | $376 | Renovated/updated. |
| 2518 THAMES CRESCENT | $1,020,000 | $1,031,000 | -1.07 | $999,900 | 21-Oct-2019 | 1993 | 23-Oct-2019 | 2,944 | $346 | Renovated/updated. |
6 out of 7 sold below assessed with a median sold price of -10.92
Pitt Meadows
| Address | Sold Price | Assessed | % Δ | True List Price | True List Date | Year Built | Sold Date | Sqft | Price per sqft | Notes |
|---|---|---|---|---|---|---|---|---|---|---|
| 11898 SPRINGDALE DRIVE | $775,000 | $785,000 | -1.27 | $789,900 | 12-Sep-2019 | 1999 | 04-Oct-2019 | 2,375 | $326 | Renovated/updated. |
| 12251 MCMYN AVENUE | $918,000 | $963,000 | -4.67 | $949,900 | 03-Sep-2019 | 2004 | 06-Oct-2019 | 2,318 | $396 | |
| 12360 NIKOLA STREET | $768,000 | $894,000 | -14.09 | $889,000 | 04-Jul-2019 | 1990 | 09-Oct-2019 | 2,089 | $367 | Renovated/updated. |
| 11769 N WILDWOOD CRESCENT | $720,000 | $706,000 | 1.98 | $749,900 | 19-Mar-2019 | 1980 | 10-Oct-2019 | 1,636 | $440 | |
| 19673 116B AVENUE | $888,000 | $849,000 | 4.59 | $914,600 | 09-Oct-2019 | 1973 | 18-Oct-2019 | 2,445 | $363 |
3 out of 5 sold below assessed with a median sold price of -1.27
Langley
| Address | Sold Price | Assessed | % Δ | True List Price | True List Date | Year Built | Sold Date | Sqft | Price per sqft | Notes |
|---|---|---|---|---|---|---|---|---|---|---|
| 21689 45 AVENUE | $949,800 | $1,009,000 | -5.87 | $949,800 | 30-Sep-2019 | 1993 | 01-Oct-2019 | 1,723 | $551 | Renovated/updated. |
| 9194 212A PLACE | $875,000 | $879,000 | -0.46 | $949,000 | 17-Jul-2019 | 1986 | 01-Oct-2019 | 2,084 | $419 | Renovated/updated. |
| 21876 64 AVENUE | $1,405,000 | $1,237,000 | 13.58 | $1,699,900 | 01-Jun-2016 | 2005 | 01-Oct-2019 | 3,195 | $439 | Renovated/updated. |
| 29 8888 216 STREET | $760,000 | $735,000 | 3.40 | $749,900 | 23-Sep-2019 | 1999 | 01-Oct-2019 | 1,880 | $404 | Renovated/updated. |
| 20601 44 AVENUE | $760,000 | $810,000 | -6.17 | $769,000 | 30-Aug-2019 | 1973 | 02-Oct-2019 | 1,572 | $483 | |
| 21886 64 AVENUE | $1,050,000 | $1,049,000 | 0.10 | $1,399,900 | 01-Jun-2016 | 2005 | 02-Oct-2019 | 1,798 | $583 | |
| 21028 76A AVENUE | $1,069,000 | $1,062,000 | 0.66 | $999,900 | 29-Mar-2019 | 2012 | 02-Oct-2019 | 3,135 | $340 | |
| 21872 45 AVENUE | $1,136,000 | $1,245,000 | -8.76 | $1,148,900 | 21-Sep-2019 | 1991 | 03-Oct-2019 | 2,849 | $398 | Renovated/updated. |
| 7841 211B STREET | $964,000 | $1,033,000 | -6.68 | $979,000 | 02-Aug-2019 | 2011 | 03-Oct-2019 | 3,222 | $299 | |
| 20015 42 AVENUE | $727,000 | $771,900 | -5.82 | $734,900 | 09-Sep-2019 | 1975 | 04-Oct-2019 | 1,280 | $567 | Renovated/updated. |
| 4865 201 STREET | $1,280,000 | $1,118,000 | 14.49 | $1,398,000 | 28-May-2019 | 2014 | 04-Oct-2019 | 4,016 | $318 | |
| 21097 78A AVENUE | $1,094,000 | $1,106,000 | -1.08 | $1,200,000 | 21-Aug-2018 | 2014 | 05-Oct-2019 | 3,100 | $352 | |
| 20891 51 AVENUE | $680,000 | $766,300 | -11.26 | $799,000 | 28-Sep-2018 | 1973 | 05-Oct-2019 | 1,323 | $513 | Renovated/updated. |
| 7275 201 STREET | $1,165,000 | $1,129,000 | 3.19 | $1,189,890 | 01-Oct-2019 | 2006 | 05-Oct-2019 | 3,389 | $343 | |
| 8759 213 STREET | $915,000 | $1,023,000 | -10.56 | $1,058,800 | 24-Apr-2019 | 1987 | 05-Oct-2019 | 2,355 | $388 | |
| 4631 198C STREET | $825,000 | $833,000 | -0.96 | $849,000 | 26-Sep-2019 | 1975 | 05-Oct-2019 | 2,280 | $361 | |
| 20936 93 AVENUE | $865,000 | $801,000 | 7.99 | $859,900 | 23-Sep-2019 | 1985 | 05-Oct-2019 | 1,887 | $458 | Renovated/updated. |
| 20567 98 AVENUE | $1,105,000 | $1,277,000 | -13.47 | $1,488,890 | 05-Jun-2019 | 1993 | 06-Oct-2019 | 4,801 | $230 | Renovated/updated. |
| 5124 219A STREET | $972,000 | $887,000 | 9.58 | $1,040,000 | 04-Jul-2019 | 1989 | 06-Oct-2019 | 1,769 | $549 | Renovated/updated. |
| 21073 77 AVENUE | $905,000 | $992,000 | -8.77 | $949,900 | 30-Aug-2019 | 2016 | 07-Oct-2019 | 2,462 | $367 | |
| 4910 215 STREET | $1,020,000 | $1,210,100 | -15.71 | $1,500,000 | 01-Jun-2016 | 1971 | 08-Oct-2019 | 1,501 | $679 | |
| 20385 94A AVENUE | $1,950,000 | $1,546,000 | 26.13 | $2,288,800 | 06-Sep-2019 | 2016 | 08-Oct-2019 | 4,314 | $452 | |
| 19669 34A AVENUE | $999,999 | $1,012,000 | -1.19 | $1,015,000 | 09-Oct-2019 | 1988 | 09-Oct-2019 | 1,968 | $508 | Renovated/updated. |
| 7896 211B STREET | $1,050,000 | $1,089,000 | -3.58 | $1,089,000 | 04-Oct-2019 | 2011 | 09-Oct-2019 | 3,005 | $349 | |
| 21710 48A AVENUE | $855,000 | $847,700 | 0.86 | $919,000 | 22-Aug-2019 | 1958 | 09-Oct-2019 | 1,650 | $518 | Renovated/updated. |
| 9464 216B STREET | $1,015,000 | $1,092,000 | -7.05 | $1,034,900 | 10-Oct-2019 | 2004 | 10-Oct-2019 | 3,560 | $285 | |
| 19906 71 AVENUE | $1,038,500 | $1,047,000 | -0.81 | $1,099,900 | 18-Jun-2019 | 2005 | 10-Oct-2019 | 3,059 | $339 | |
| 2530 WILDING COURT | $730,000 | $773,000 | -5.56 | $769,000 | 10-Apr-2019 | 1980 | 10-Oct-2019 | 1,730 | $421 | Renovated/updated. |
| 8424 208A STREET | $900,000 | $1,049,000 | -14.20 | $1,050,000 | 18-Jul-2018 | 2006 | 10-Oct-2019 | 2,682 | $335 | |
| 21024 79A AVENUE | $1,041,000 | $1,098,000 | -5.19 | $1,079,000 | 09-Oct-2019 | 2011 | 12-Oct-2019 | 2,980 | $349 | |
| 20725 91B AVENUE | $948,600 | $1,113,000 | -14.77 | $948,600 | 09-Oct-2019 | 1994 | 12-Oct-2019 | 2,200 | $431 | |
| 8929 MOWAT STREET | $1,060,000 | $1,058,100 | 0.18 | $1,149,000 | 07-Aug-2019 | 1972 | 12-Oct-2019 | 1,108 | $956 | Renovated/updated. |
| 5111 223 STREET | $1,065,000 | $990,000 | 7.58 | $1,038,000 | 10-Oct-2019 | 2010 | 14-Oct-2019 | 3,540 | $300 | |
| 20469 42 AVENUE | $1,784,280 | $1,178,000 | 51.47 | $1,898,000 | 30-Aug-2019 | 2017 | 14-Oct-2019 | 6,413 | $278 | |
| 20867 52A AVENUE | $750,000 | $801,600 | -6.44 | $799,000 | 03-Sep-2019 | 1975 | 15-Oct-2019 | 1,000 | $750 | |
| 7043 201 STREET | $1,020,000 | $1,051,000 | -2.95 | $1,079,000 | 29-Jul-2019 | 2003 | 15-Oct-2019 | 3,039 | $335 | |
| 20367 42A AVENUE | $1,025,000 | $903,000 | 13.51 | $1,289,000 | 05-Oct-2017 | 1972 | 15-Oct-2019 | 2,198 | $466 | |
| 19644 73B AVENUE | $1,035,000 | $1,037,000 | -0.19 | $1,068,000 | 07-Jun-2019 | 2004 | 15-Oct-2019 | 3,277 | $315 | |
| 20043 41A AVENUE | $922,000 | $1,018,000 | -9.43 | $935,000 | 08-Oct-2019 | 1984 | 16-Oct-2019 | 2,096 | $439 | |
| 9387 212 STREET | $785,000 | $836,000 | -6.10 | $789,000 | 08-Oct-2019 | 1983 | 16-Oct-2019 | 1,322 | $593 | |
| 19984 45A AVENUE | $868,000 | $828,500 | 4.77 | $878,800 | 18-Oct-2019 | 1974 | 19-Oct-2019 | 2,242 | $387 | |
| 3698 196A STREET | $997,000 | $893,000 | 11.65 | $999,000 | 18-Oct-2019 | 1972 | 20-Oct-2019 | 2,600 | $383 | |
| 21123 45A CRESCENT | $1,150,000 | $1,385,000 | -16.97 | $1,390,000 | 25-Sep-2018 | 1997 | 20-Oct-2019 | 4,631 | $248 | |
| 2671 WILDWOOD DRIVE | $659,000 | $763,000 | -13.63 | $629,900 | 16-Oct-2019 | 1983 | 21-Oct-2019 | 2,125 | $310 |
28 out of 44 sold below assessed with a median sold price of -2.07
Maple Ridge
| Address | Sold Price | Assessed | % Δ | True List Price | True List Date | Year Built | Sold Date | Sqft | Price per sqft | Notes |
|---|---|---|---|---|---|---|---|---|---|---|
| 11785 252 STREET | $1,199,800 | $1,117,000 | 7.41 | $1,199,800 | 26-Aug-2019 | 2016 | 01-Oct-2019 | 2,198 | $545 | |
| 11035 CARMICHAEL STREET | $1,435,000 | $958,000 | 49.79 | $1,750,000 | 09-Feb-2018 | 2018 | 01-Oct-2019 | 4,928 | $291 | |
| 10782 ERSKINE STREET | $760,000 | $866,000 | -12.24 | $814,900 | 29-Mar-2019 | 2011 | 01-Oct-2019 | 2,193 | $346 | |
| 11085 CARMICHAEL STREET | $1,540,000 | $1,368,000 | 12.57 | $1,450,000 | 30-Sep-2016 | 2017 | 01-Oct-2019 | 4,930 | $312 | |
| 22400 MORSE CRESCENT | $710,000 | $713,000 | -0.42 | $752,900 | 15-Aug-2019 | 1987 | 02-Oct-2019 | 2,346 | $302 | |
| 20273 KENT STREET | $915,000 | $942,000 | -2.87 | $1,009,000 | 13-Apr-2019 | 2000 | 02-Oct-2019 | 3,156 | $289 | |
| 9865 286 STREET | $810,000 | $422,800 | 91.58 | $949,900 | 22-Dec-2017 | 2018 | 04-Oct-2019 | 2,074 | $390 | |
| 12102 230 STREET | $1,094,000 | $740,000 | 47.84 | $1,150,000 | 16-May-2019 | 2018 | 05-Oct-2019 | 3,228 | $338 | |
| 23684 114A AVENUE | $961,900 | $946,000 | 1.68 | $1,088,000 | 24-Apr-2018 | 2002 | 05-Oct-2019 | 2,872 | $334 | |
| 22964 GILLEY AVENUE | $628,500 | $811,000 | -22.50 | $699,900 | 07-Aug-2019 | 1975 | 06-Oct-2019 | 1,624 | $387 | Renovated/updated. |
| 23186 124A AVENUE | $817,500 | $687,000 | 19.00 | $849,900 | 23-Sep-2019 | 1988 | 06-Oct-2019 | 1,668 | $490 | Renovated/updated. |
| 24020 100 AVENUE | $796,000 | $833,000 | -4.44 | $948,000 | 24-Sep-2018 | 2002 | 06-Oct-2019 | 2,904 | $274 | Renovated/updated. |
| 20384 KENT STREET | $605,000 | $646,000 | -6.35 | $629,000 | 17-Jul-2019 | 1948 | 07-Oct-2019 | 1,030 | $587 | Renovated/updated. |
| 22986 124B AVENUE | $885,000 | $884,000 | 0.11 | $979,000 | 15-Jul-2019 | 1990 | 07-Oct-2019 | 2,730 | $324 | Renovated/updated. |
| 20670 W RIVER ROAD | $675,000 | $791,000 | -14.66 | $690,000 | 30-Sep-2019 | 1990 | 07-Oct-2019 | 1,386 | $487 | |
| 11856 CRAWFORD STREET | $650,000 | $775,000 | -16.13 | $699,900 | 19-Aug-2019 | 1987 | 07-Oct-2019 | 1,930 | $336 | |
| 20613 125 AVENUE | $1,049,000 | $1,166,000 | -10.03 | $969,000 | 12-Aug-2019 | 1995 | 08-Oct-2019 | 3,806 | $275 | |
| 24220 103A AVENUE | $777,500 | $816,000 | -4.72 | $864,900 | 01-May-2019 | 2009 | 08-Oct-2019 | 2,600 | $299 | |
| 11621 238A STREET | $850,000 | $929,000 | -8.50 | $829,800 | 19-Sep-2019 | 2002 | 09-Oct-2019 | 3,146 | $270 | |
| 11775 212 STREET | $745,000 | $829,000 | -10.13 | $729,900 | 01-Oct-2019 | 1981 | 09-Oct-2019 | 1,858 | $400 | Renovated/updated. |
| 23677 BOULDER PLACE | $905,000 | $1,023,000 | -11.53 | $979,000 | 17-Sep-2019 | 2001 | 10-Oct-2019 | 3,125 | $289 | |
| 13797 230A STREET | $835,000 | $966,000 | -13.56 | $869,900 | 26-Jun-2019 | 2011 | 10-Oct-2019 | 2,448 | $341 | |
| 11686 232B STREET | $858,000 | $839,000 | 2.26 | $863,800 | 07-Sep-2019 | 1992 | 11-Oct-2019 | 2,498 | $343 | |
| 10503 SLATFORD STREET | $1,012,000 | $1,164,000 | -13.06 | $1,049,000 | 21-May-2019 | 1998 | 11-Oct-2019 | 3,987 | $253 | |
| 23350 123 PLACE | $700,000 | $755,000 | -7.28 | $736,900 | 07-Jun-2019 | 1989 | 12-Oct-2019 | 1,902 | $368 | |
| 22525 KENDRICK LOOP | $650,850 | $720,000 | -9.60 | $649,900 | 23-Sep-2019 | 1986 | 12-Oct-2019 | 2,121 | $306 | |
| 11673 232A STREET | $875,000 | $817,000 | 7.10 | $884,900 | 18-Sep-2019 | 1992 | 12-Oct-2019 | 2,087 | $419 | |
| 20358 118 AVENUE | $755,000 | $724,000 | 4.28 | $875,000 | 30-May-2019 | 1961 | 12-Oct-2019 | 3,327 | $226 | |
| 23653 133 AVENUE | $890,000 | $891,000 | -0.11 | $917,900 | 25-Sep-2019 | 2007 | 16-Oct-2019 | 2,619 | $339 | |
| 20837 STONEY AVENUE | $825,000 | $802,000 | 2.87 | $888,000 | 01-Oct-2019 | 1974 | 17-Oct-2019 | 2,090 | $394 | |
| 13967 ANDERSON CREEK DRIVE | $1,060,000 | $1,132,000 | -6.36 | $1,188,000 | 29-May-2019 | 2009 | 17-Oct-2019 | 3,712 | $285 | |
| 20192 CHIGWELL STREET | $680,000 | $746,000 | -8.85 | $699,900 | 09-Sep-2019 | 1930 | 20-Oct-2019 | 2,152 | $315 | |
| 20280 121 AVENUE | $842,500 | $935,000 | -9.89 | $898,800 | 27-May-2019 | 1990 | 21-Oct-2019 | 2,985 | $282 | |
| 24903 108 AVENUE | $992,000 | $1,127,000 | -11.98 | $1,088,000 | 04-Mar-2019 | 2010 | 23-Oct-2019 | 4,536 | $218 |
22 out of 34 sold below assessed with a median sold price of -5.53
White Rock
| Address | Sold Price | Assessed | % Δ | True List Price | True List Date | Year Built | Sold Date | Sqft | Price per sqft | Notes |
|---|---|---|---|---|---|---|---|---|---|---|
| 15917 GOGGS AVENUE | $835,000 | $911,800 | -8.42 | $998,000 | 08-Sep-2019 | 1972 | 01-Oct-2019 | 2,206 | $378 | Renovated/updated. |
| 1426 KENT STREET | $985,000 | $988,800 | -0.38 | $1,175,000 | 15-May-2019 | 1970 | 01-Oct-2019 | 1,679 | $586 | |
| 13769 MALABAR AVENUE | $900,000 | $1,083,000 | -16.90 | $965,000 | 04-Sep-2019 | 1973 | 11-Oct-2019 | 1,348 | $667 | |
| 15880 VINE AVENUE | $980,000 | $1,044,300 | -6.16 | $999,000 | 27-Jun-2019 | 1971 | 16-Oct-2019 | 1,160 | $844 |
4 out of 4 sold below assessed with a median sold price of -7.29
Lions Bay
| Address | Sold Price | Assessed | % Δ | True List Price | True List Date | Year Built | Sold Date | Sqft | Price per sqft | Notes |
|---|---|---|---|---|---|---|---|---|---|---|
| 410 MOUNTAIN DRIVE | $2,100,000 | $1,760,000 | 19.32 | $2,500,000 | 01-Mar-2019 | 1986 | 13-Oct-2019 | 4,354 | $482 | Renovated/updated. |
| 340 MOUNTAIN DRIVE | $900,000 | $1,274,000 | -29.36 | $920,000 | 07-Oct-2019 | 1974 | 18-Oct-2019 | 1,877 | $479 |
1 out of 2 sold below assessed with a median sold price of -5.02
Belcarra
| Address | Sold Price | Assessed | % Δ | True List Price | True List Date | Year Built | Sold Date | Sqft | Price per sqft | Notes |
|---|---|---|---|---|---|---|---|---|---|---|
| 3314 BEDWELL BAY ROAD | $2,058,000 | $2,175,000 | -5.38 | $3,188,000 | 21-Jun-2017 | 1987 | 16-Oct-2019 | 4,638 | $443 | Renovated/updated. |
1 out of 1 sold below assessed with a median sold price of -5.38