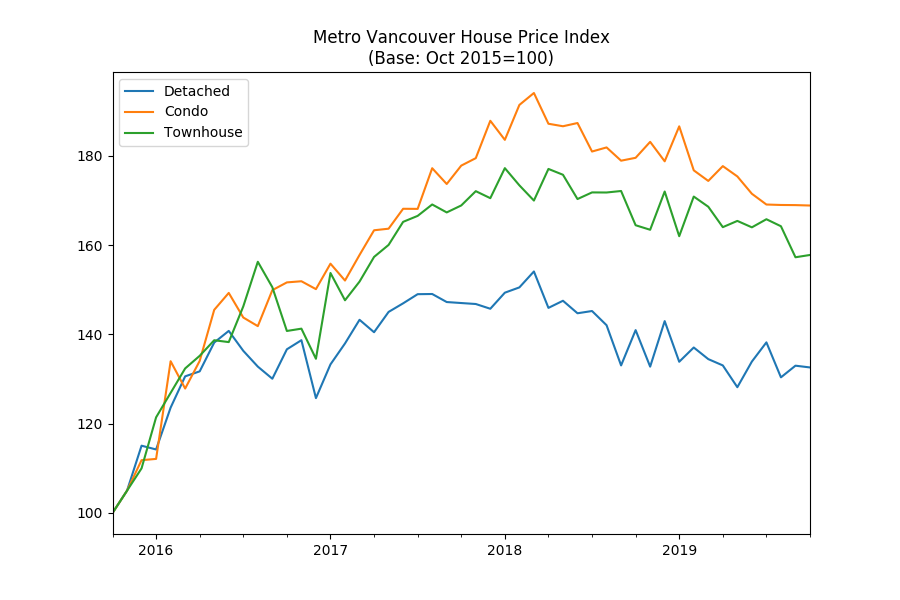
Metro Vancouver townhouse prices fell in October compared to the year before, with some homes in Vancouver proper selling for as low as $388 per square foot.
The OpenHousing Home Price Index for Metro Vancouver townhouses – calculated using the generally-accepted and transparent repeat sales or Case-Shiller method1 – fell 4% year-over-year, the September final update shows.
Open House House Price Index covers Vancouver, Richmond, Burnaby, West Vancouver, New Westminster, North Vancouver, Delta, Surrey, Port Moody, Coquitlam, Port Coquitlam, Pitt Meadows, Maple Ridge, Lions Bay, Bower Island, Anmore, and Belcarra, Langley and White Rock. Data for Vancouver also include University British Columbia and University Endowment Lands.
Here’s what the sales looked like in the last 30 days:
Vancouver
| Address | Sold Price | Assessed | % Δ | True List Price | True List Date | Year Built | Sold Date | Sqft | Price per sqft | Notes |
|---|---|---|---|---|---|---|---|---|---|---|
| 210 655 W 7TH AVENUE | $839,000 | $786,000 | 6.74 | $838,000 | 01-Oct-2019 | 1996 | 07-Oct-2019 | 979 | $856 | |
| 3403 LYNMOOR PLACE | $587,500 | $639,000 | -8.06 | $598,000 | 25-Sep-2019 | 1982 | 07-Oct-2019 | 1,238 | $474 | |
| 2408 W PINE STREET | $1,340,000 | $1,356,000 | -1.18 | $1,349,000 | 01-Oct-2019 | 2008 | 07-Oct-2019 | 1,510 | $887 | |
| 7 850 W 8TH AVENUE | $1,285,000 | $1,232,000 | 4.30 | $1,300,000 | 09-Sep-2019 | 2009 | 07-Oct-2019 | 1,249 | $1,028 | |
| 3536 W 5TH AVENUE | $1,325,000 | $1,329,000 | -0.30 | $1,335,000 | 30-Sep-2019 | 2006 | 07-Oct-2019 | 1,168 | $1,134 | |
| 2171 MAPLE STREET | $2,600,000 | $3,959,000 | -34.33 | $2,820,000 | 15-Jul-2019 | 1925 | 08-Oct-2019 | 2,227 | $1,167 | Assessment done before completion. |
| 102 755 W 15TH AVENUE | $682,500 | $645,000 | 5.81 | $599,000 | 01-Oct-2019 | 1992 | 08-Oct-2019 | 833 | $819 | |
| 1724 CYPRESS STREET | $1,025,000 | $1,054,000 | -2.75 | $998,900 | 01-Oct-2019 | 1983 | 08-Oct-2019 | 1,352 | $758 | Renovated/updated. |
| 2309 RIVERWOOD WAY | $796,000 | $786,000 | 1.27 | $799,900 | 02-Oct-2019 | 1986 | 08-Oct-2019 | 1,429 | $557 | Renovated/updated. |
| 2540 W 2ND AVENUE | $725,000 | $780,000 | -7.05 | $789,000 | 18-Jun-2019 | 1912 | 08-Oct-2019 | 872 | $831 | |
| 7 3574 E 49TH AVENUE | $675,000 | $561,500 | 20.21 | $685,000 | 01-Oct-2019 | 1971 | 08-Oct-2019 | 1,336 | $505 | Renovated/updated. |
| 5336 LARCH STREET | $1,700,000 | $2,178,000 | -21.95 | $1,799,000 | 19-Sep-2019 | 2000 | 09-Oct-2019 | 2,008 | $846 | |
| 1557 W 57TH AVENUE | $1,237,140 | $1,280,000 | -3.35 | $1,799,900 | 07-May-2019 | 2018 | 10-Oct-2019 | 1,085 | $1,140 | |
| 1502 W 57TH AVENUE | $1,775,000 | $1,893,000 | -6.23 | $2,258,800 | 30-May-2016 | 2018 | 11-Oct-2019 | 1,787 | $993 | |
| 3379 FLAGSTAFF PLACE | $685,000 | $775,000 | -11.61 | $699,000 | 07-Oct-2019 | 1983 | 11-Oct-2019 | 1,703 | $402 | Renovated/updated. |
| 59 3436 TERRA VITA PLACE | $785,000 | $725,000 | 8.28 | $819,000 | 08-May-2019 | 1997 | 11-Oct-2019 | 1,404 | $559 | Renovated/updated. |
| 1465 W HASTINGS STREET | $1,875,000 | $1,918,000 | -2.24 | $1,980,000 | 19-Jun-2019 | 2003 | 12-Oct-2019 | 1,402 | $1,337 | Renovated/updated. |
| 3804 COMMERCIAL STREET | $1,087,000 | $1,166,000 | -6.78 | $1,123,000 | 05-Oct-2019 | 2006 | 13-Oct-2019 | 1,176 | $924 | Renovated/updated. |
| 3170 PRINCE EDWARD STREET | $810,000 | $897,000 | -9.70 | $898,000 | 11-Sep-2019 | 2012 | 14-Oct-2019 | 868 | $933 | |
| 16 531 E 16TH AVENUE | $1,265,000 | $1,377,000 | -8.13 | $1,398,000 | 12-Apr-2019 | 2017 | 14-Oct-2019 | 1,363 | $928 | |
| 6080 CHANCELLOR MEWS | $1,149,000 | $1,215,000 | -5.43 | $1,299,000 | 29-Apr-2019 | 2009 | 16-Oct-2019 | 1,510 | $760 | |
| 209 2273 TRIUMPH STREET | $820,000 | $853,000 | -3.87 | $839,000 | 10-Oct-2019 | 2015 | 16-Oct-2019 | 1,004 | $816 | |
| 1680 W 8TH AVENUE | $1,500,000 | $1,360,000 | 10.29 | $1,995,000 | 15-Jun-2016 | 2008 | 16-Oct-2019 | 1,430 | $1,048 | |
| 3389 FLAGSTAFF PLACE | $655,000 | $775,000 | -15.48 | $719,900 | 01-May-2019 | 1983 | 17-Oct-2019 | 1,685 | $388 | |
| 106 8 SMITHE MEWS | $2,380,000 | $3,047,000 | -21.89 | $2,498,800 | 24-Sep-2019 | 2008 | 17-Oct-2019 | 1,981 | $1,201 | |
| 101 1855 STAINSBURY AVENUE | $1,090,000 | $970,000 | 12.37 | $1,038,000 | 17-Jun-2019 | 2008 | 19-Oct-2019 | 1,220 | $893 | |
| 5368 LARCH STREET | $1,580,000 | $1,824,000 | -13.38 | $1,628,000 | 17-Sep-2019 | 2000 | 19-Oct-2019 | 1,839 | $859 | Renovated/updated. |
| 2170 WALL STREET | $750,000 | $741,000 | 1.21 | $799,000 | 01-Oct-2019 | 2006 | 21-Oct-2019 | 1,079 | $695 | |
| 1927 W 14TH AVENUE | $837,500 | $978,300 | -14.39 | $799,900 | 15-Oct-2019 | 1910 | 21-Oct-2019 | 974 | $859 | |
| 1563 W 57TH AVENUE | $1,519,050 | $1,462,000 | 3.90 | $1,899,900 | 19-Jul-2019 | 2018 | 21-Oct-2019 | 1,324 | $1,147 | |
| 3187 QUEBEC STREET | $1,309,000 | $1,331,000 | -1.65 | $1,328,000 | 30-Sep-2019 | 2016 | 24-Oct-2019 | 1,295 | $1,010 | |
| 471 HAWKS AVENUE | $987,500 | $1,082,000 | -8.73 | $1,099,000 | 29-Apr-2019 | 2014 | 24-Oct-2019 | 1,205 | $819 | |
| 1808 CROWE STREET | $880,000 | $874,000 | 0.69 | $880,000 | 21-Oct-2019 | 2012 | 26-Oct-2019 | 851 | $1,034 | |
| 2339 SCOTIA STREET | $1,330,000 | $1,334,000 | -0.30 | $1,299,000 | 14-Oct-2019 | 2011 | 28-Oct-2019 | 1,269 | $1,048 | Renovated/updated. |
| 322 W 62ND AVENUE | $1,385,000 | $1,506,000 | -8.03 | $1,688,000 | 23-Apr-2019 | 2017 | 29-Oct-2019 | 1,461 | $947 |
24 out of 35 sold below assessed with a median sold price of -3.35
Richmond
| Address | Sold Price | Assessed | % Δ | True List Price | True List Date | Year Built | Sold Date | Sqft | Price per sqft | Notes |
|---|---|---|---|---|---|---|---|---|---|---|
| 220 6111 LONDON ROAD | $717,750 | $915,000 | -21.56 | $724,000 | 12-Aug-2019 | 2007 | 07-Oct-2019 | 1,466 | $489 | |
| 36 6111 TIFFANY BOULEVARD | $645,000 | $706,000 | -8.64 | $650,000 | 23-Sep-2019 | 1980 | 07-Oct-2019 | 1,408 | $458 | Renovated/updated. |
| 14 9111 NO. 5 ROAD | $565,000 | $634,600 | -10.97 | $658,000 | 18-Apr-2019 | 1975 | 08-Oct-2019 | 1,585 | $356 | |
| 30 3711 ROBSON COURT | $655,000 | $790,000 | -17.09 | $760,900 | 30-Apr-2019 | 1998 | 08-Oct-2019 | 1,371 | $477 | Renovated/updated. |
| 303 4900 FRANCIS ROAD | $642,000 | $671,800 | -4.44 | $670,000 | 20-Aug-2019 | 1977 | 08-Oct-2019 | 1,310 | $490 | Renovated/updated. |
| 7 9751 FERNDALE ROAD | $770,000 | $806,000 | -4.47 | $848,000 | 12-Jun-2019 | 2008 | 09-Oct-2019 | 1,267 | $607 | |
| 44 10200 4TH AVENUE | $566,000 | $571,300 | -0.93 | $578,000 | 06-Sep-2019 | 1971 | 09-Oct-2019 | 1,368 | $413 | Renovated/updated. |
| 38 10388 NO. 2 ROAD | $1,305,000 | $1,490,000 | -12.42 | $1,688,000 | 27-Aug-2018 | 2016 | 10-Oct-2019 | 1,966 | $663 | |
| 5 9780 GENERAL CURRIE ROAD | $875,000 | $1,017,000 | -13.96 | $1,168,000 | 16-Apr-2018 | 2017 | 11-Oct-2019 | 1,521 | $575 | |
| 102 22382 SHARPE AVENUE | $720,000 | $795,000 | -9.43 | $799,000 | 02-May-2019 | 2013 | 12-Oct-2019 | 1,622 | $443 | |
| 17 7733 HEATHER STREET | $835,000 | $913,000 | -8.54 | $958,000 | 09-Oct-2018 | 2003 | 12-Oct-2019 | 1,332 | $626 | |
| 18 7051 ASH STREET | $860,000 | $920,000 | -6.52 | $928,000 | 17-Oct-2018 | 2011 | 12-Oct-2019 | 1,530 | $562 | |
| 68 3088 AIREY DRIVE | $772,000 | $793,000 | -2.65 | $819,000 | 11-Jul-2019 | 1998 | 14-Oct-2019 | 1,426 | $541 | Renovated/updated. |
| 37 9833 KEEFER AVENUE | $930,800 | $1,117,000 | -16.67 | $998,000 | 08-May-2019 | 2006 | 14-Oct-2019 | 1,669 | $557 | |
| 6 7231 NO. 2 ROAD | $735,000 | $849,000 | -13.43 | $838,000 | 07-May-2019 | 2009 | 16-Oct-2019 | 1,243 | $591 | |
| 115 10000 FISHER GATE | $932,000 | $955,000 | -2.41 | $998,000 | 29-Apr-2019 | 1994 | 16-Oct-2019 | 1,922 | $484 | Renovated/updated. |
| 37 7833 HEATHER STREET | $1,010,000 | $960,000 | 5.21 | $1,080,000 | 08-Sep-2019 | 2004 | 18-Oct-2019 | 1,610 | $627 | |
| 11 9171 FERNDALE ROAD | $720,000 | $879,000 | -18.09 | $888,000 | 28-Aug-2018 | 2008 | 19-Oct-2019 | 1,432 | $502 | |
| 51 6833 LIVINGSTONE PLACE | $618,000 | $656,000 | -5.79 | $633,800 | 20-Sep-2019 | 1998 | 20-Oct-2019 | 1,069 | $578 | Renovated/updated. |
| 7 7733 HEATHER STREET | $838,000 | $856,000 | -2.10 | $928,000 | 06-Apr-2019 | 2003 | 21-Oct-2019 | 1,275 | $657 | Renovated/updated. |
| 13 10222 NO. 1 ROAD | $849,000 | $875,000 | -2.97 | $1,018,880 | 22-May-2018 | 2005 | 21-Oct-2019 | 1,483 | $572 | |
| 3 5988 BLANSHARD DRIVE | $840,000 | $955,000 | -12.04 | $948,000 | 09-May-2019 | 2001 | 22-Oct-2019 | 1,426 | $589 | |
| 103 8020 COLONIAL DRIVE | $391,250 | $353,000 | 10.84 | $399,900 | 10-Oct-2019 | 1977 | 22-Oct-2019 | 767 | $510 | Renovated/updated. |
| 34 7051 ASH STREET | $835,000 | $1,023,000 | -18.38 | $1,038,000 | 04-Sep-2018 | 2011 | 24-Oct-2019 | 1,464 | $570 | |
| 9 11511 STEVESTON HIGHWAY | $838,000 | $869,000 | -3.57 | $899,000 | 12-Feb-2018 | 2007 | 25-Oct-2019 | 1,423 | $588 |
23 out of 25 sold below assessed with a median sold price of -8.54
Burnaby
| Address | Sold Price | Assessed | % Δ | True List Price | True List Date | Year Built | Sold Date | Sqft | Price per sqft | Notes |
|---|---|---|---|---|---|---|---|---|---|---|
| 8206 AMBERWOOD PLACE | $649,000 | $640,400 | 1.34 | $649,000 | 02-Oct-2019 | 1977 | 07-Oct-2019 | 1,333 | $486 | Renovated/updated. |
| 2368 ALPHA AVENUE | $1,000,000 | $1,348,000 | -25.82 | $1,358,900 | 13-Nov-2018 | 2018 | 07-Oct-2019 | 1,394 | $717 | |
| 23 4055 PENDER STREET | $866,000 | $972,000 | -10.91 | $865,000 | 01-Oct-2019 | 2006 | 07-Oct-2019 | 1,201 | $721 | |
| 102 5211 IRMIN STREET | $595,000 | $607,000 | -1.98 | $596,800 | 18-Jun-2019 | 2009 | 08-Oct-2019 | 843 | $705 | |
| 104 3788 NORFOLK STREET | $628,000 | $701,000 | -10.41 | $638,000 | 12-Sep-2019 | 2012 | 08-Oct-2019 | 1,014 | $619 | |
| 4173 HALIFAX STREET | $1,155,000 | $1,288,000 | -10.33 | $1,198,000 | 30-Sep-2019 | 2015 | 09-Oct-2019 | 1,353 | $853 | |
| 4 7433 16TH STREET | $728,800 | $812,000 | -10.25 | $788,888 | 10-Jun-2019 | 1994 | 09-Oct-2019 | 1,719 | $423 | Renovated/updated. |
| 38 7370 STRIDE AVENUE | $555,000 | $638,000 | -13.01 | $598,000 | 02-Jul-2019 | 2006 | 12-Oct-2019 | 883 | $628 | |
| 15 5883 IRMIN STREET | $907,000 | $959,000 | -5.42 | $949,900 | 12-Jul-2019 | 2009 | 14-Oct-2019 | 1,359 | $667 | |
| 16 9151 FOREST GROVE DRIVE | $532,000 | $560,500 | -5.08 | $599,000 | 04-Jul-2019 | 1981 | 15-Oct-2019 | 1,200 | $443 | Renovated/updated. |
| 2 5881 IRMIN STREET | $899,000 | $959,000 | -6.26 | $948,000 | 12-Jun-2019 | 2009 | 16-Oct-2019 | 1,428 | $629 | |
| 51 7500 CUMBERLAND STREET | $920,000 | $1,000,000 | -8.00 | $988,800 | 21-May-2019 | 1994 | 16-Oct-2019 | 1,971 | $466 | |
| 105 7533 GILLEY AVENUE | $765,000 | $828,000 | -7.61 | $789,000 | 16-Sep-2019 | 2013 | 17-Oct-2019 | 1,281 | $597 | |
| 3 6878 SOUTHPOINT DRIVE | $759,000 | $770,000 | -1.43 | $749,000 | 07-Oct-2019 | 2005 | 17-Oct-2019 | 1,169 | $649 | |
| 37 6577 SOUTHOAKS CRESCENT | $682,500 | $775,000 | -11.94 | $749,000 | 13-Jun-2019 | 1996 | 18-Oct-2019 | 1,465 | $465 | |
| 12 7520 18TH STREET | $534,500 | $572,000 | -6.56 | $638,800 | 14-Jun-2018 | 1992 | 20-Oct-2019 | 1,054 | $507 | |
| 8555 WOODRIDGE PLACE | $725,000 | $692,100 | 4.75 | $699,900 | 15-Oct-2019 | 1981 | 21-Oct-2019 | 1,786 | $405 | Renovated/updated. |
| 9207 CAMERON STREET | $798,000 | $761,000 | 4.86 | $798,000 | 15-Oct-2019 | 2003 | 21-Oct-2019 | 1,273 | $626 | Renovated/updated. |
| 3 3737 PENDER STREET | $730,000 | $686,000 | 6.41 | $749,000 | 17-Oct-2019 | 2002 | 21-Oct-2019 | 985 | $741 | Renovated/updated. |
| 8 7489 16TH STREET | $784,000 | $894,000 | -12.30 | $829,000 | 07-Aug-2019 | 2010 | 21-Oct-2019 | 1,236 | $634 | |
| 57 5298 OAKMOUNT CRESCENT | $1,150,000 | $1,268,000 | -9.31 | $1,288,000 | 28-May-2019 | 1995 | 22-Oct-2019 | 2,417 | $475 | |
| 3369 GANYMEDE DRIVE | $616,000 | $602,100 | 2.31 | $600,000 | 23-Oct-2019 | 1971 | 26-Oct-2019 | 1,312 | $469 |
17 out of 22 sold below assessed with a median sold price of -7.08
West Vancouver
| Address | Sold Price | Assessed | % Δ | True List Price | True List Date | Year Built | Sold Date | Sqft | Price per sqft | Notes |
|---|---|---|---|---|---|---|---|---|---|---|
| 348 TAYLOR WAY | $998,000 | $1,388,000 | -28.10 | $1,288,000 | 27-May-2019 | 1992 | 27-Oct-2019 | 2,035 | $490 | Renovated/updated. |
1 out of 1 sold below assessed with a median sold price of -28.10
New Westminster
| Address | Sold Price | Assessed | % Δ | True List Price | True List Date | Year Built | Sold Date | Sqft | Price per sqft | Notes |
|---|---|---|---|---|---|---|---|---|---|---|
| 11 168 SIXTH STREET | $782,500 | $799,000 | -2.07 | $788,000 | 04-Oct-2019 | 2004 | 08-Oct-2019 | 1,748 | $447 | Renovated/updated. |
| 233 600 PARK CRESCENT | $750,000 | $747,000 | 0.40 | $774,900 | 04-Sep-2019 | 2003 | 12-Oct-2019 | 1,381 | $543 |
1 out of 2 sold below assessed with a median sold price of -0.83
North Vancouver
| Address | Sold Price | Assessed | % Δ | True List Price | True List Date | Year Built | Sold Date | Sqft | Price per sqft | Notes |
|---|---|---|---|---|---|---|---|---|---|---|
| 1200 PREMIER STREET | $753,000 | $757,000 | -0.53 | $759,000 | 24-Sep-2019 | 1970 | 09-Oct-2019 | 1,789 | $420 | Renovated/updated. |
| 201 W 19TH STREET | $1,195,000 | $1,348,000 | -11.35 | $1,299,900 | 16-Sep-2019 | 2012 | 09-Oct-2019 | 1,731 | $690 | |
| 41 550 BROWNING PLACE | $1,025,000 | $1,117,000 | -8.24 | $1,175,000 | 21-May-2019 | 2006 | 10-Oct-2019 | 1,715 | $597 | |
| 4 2425 EDGEMONT BOULEVARD | $1,280,000 | $963,000 | 32.92 | $1,295,000 | 16-Sep-2019 | 1991 | 11-Oct-2019 | 1,658 | $772 | Renovated/updated. |
| 3137 CAPILANO CRESCENT | $1,092,500 | $1,309,000 | -16.54 | $1,249,900 | 09-Nov-2018 | 2002 | 12-Oct-2019 | 1,512 | $722 | Renovated/updated. |
| 3948 INDIAN RIVER DRIVE | $930,000 | $972,000 | -4.32 | $959,900 | 17-Sep-2019 | 1986 | 15-Oct-2019 | 1,786 | $520 | Renovated/updated. |
| 1970 PURCELL WAY | $630,000 | $748,100 | -15.79 | $699,000 | 26-Jul-2019 | 1976 | 17-Oct-2019 | 1,665 | $378 | |
| 2 250 E KEITH ROAD | $977,500 | $1,118,000 | -12.57 | $1,098,000 | 19-Mar-2019 | 1996 | 23-Oct-2019 | 1,750 | $558 |
7 out of 8 sold below assessed with a median sold price of -9.79
Delta
| Address | Sold Price | Assessed | % Δ | True List Price | True List Date | Year Built | Sold Date | Sqft | Price per sqft | Notes |
|---|---|---|---|---|---|---|---|---|---|---|
| 41 10415 DELSOM CRESCENT | $648,000 | $779,000 | -16.82 | $719,000 | 20-Aug-2019 | 2010 | 08-Oct-2019 | 1,619 | $400 | |
| 20 4949 57 STREET | $490,000 | $456,700 | 7.29 | $529,000 | 24-Jul-2019 | 1969 | 12-Oct-2019 | 1,152 | $425 | Renovated/updated. |
| 50 6712 BAKER ROAD | $516,000 | $528,800 | -2.42 | $529,000 | 17-Jun-2019 | 1979 | 13-Oct-2019 | 1,287 | $400 | Renovated/updated. |
| 7 8385 DELSOM WAY | $605,000 | $614,000 | -1.47 | $649,000 | 12-Aug-2019 | 2008 | 15-Oct-2019 | 1,618 | $373 | |
| 4841 55B STREET | $560,000 | $567,900 | -1.39 | $579,900 | 08-Oct-2019 | 1976 | 17-Oct-2019 | 1,532 | $365 | Renovated/updated. |
| 208 4808 LINDEN DRIVE | $519,000 | $561,000 | -7.49 | $529,900 | 08-Oct-2019 | 2011 | 23-Oct-2019 | 1,069 | $485 |
5 out of 6 sold below assessed with a median sold price of -1.94
Surrey
| Address | Sold Price | Assessed | % Δ | True List Price | True List Date | Year Built | Sold Date | Sqft | Price per sqft | Notes |
|---|---|---|---|---|---|---|---|---|---|---|
| 198 2501 161A STREET | $590,000 | $626,000 | -5.75 | $678,000 | 18-Jun-2018 | 2011 | 07-Oct-2019 | 1,434 | $411 | |
| 28 14655 32 AVENUE | $1,015,000 | $997,000 | 1.81 | $1,188,000 | 10-Oct-2017 | 2007 | 07-Oct-2019 | 2,727 | $372 | |
| 60 14356 63A AVENUE | $524,000 | $546,000 | -4.03 | $609,950 | 08-Mar-2018 | 2011 | 07-Oct-2019 | 1,423 | $368 | |
| 2 10505 171 STREET | $730,000 | $773,000 | -5.56 | $749,900 | 05-Sep-2019 | 1995 | 07-Oct-2019 | 2,080 | $350 | Renovated/updated. |
| 105 9989 E BARNSTON DRIVE | $607,000 | $688,000 | -11.77 | $649,000 | 17-Sep-2019 | 2015 | 07-Oct-2019 | 1,697 | $357 | |
| 1817 10620 150 STREET | $378,500 | $361,900 | 4.59 | $409,000 | 18-Sep-2019 | 1980 | 07-Oct-2019 | 926 | $408 | Renovated/updated. |
| 6 14909 32 AVENUE | $720,000 | $883,000 | -18.46 | $759,000 | 29-Jul-2019 | 1995 | 08-Oct-2019 | 1,440 | $500 | |
| 74 14655 32 AVENUE | $940,000 | $943,000 | -0.32 | $988,000 | 19-Aug-2019 | 2007 | 08-Oct-2019 | 2,727 | $344 | |
| 11 8220 121A STREET | $573,000 | $559,000 | 2.50 | $599,900 | 12-Jun-2019 | 1988 | 08-Oct-2019 | 1,802 | $317 | |
| 1809 LILAC DRIVE | $480,000 | $513,700 | -6.56 | $525,000 | 08-Aug-2019 | 1979 | 08-Oct-2019 | 1,800 | $266 | Renovated/updated. |
| 2 19295 72 AVENUE | $525,000 | $490,000 | 7.14 | $545,000 | 27-Sep-2019 | 2012 | 09-Oct-2019 | 1,265 | $415 | |
| 137 13958 108 AVENUE | $345,000 | $355,000 | -2.82 | $394,800 | 23-Apr-2019 | 2008 | 09-Oct-2019 | 737 | $468 | |
| 30 9088 HOLT ROAD | $493,000 | $470,500 | 4.78 | $509,900 | 09-Sep-2019 | 1994 | 09-Oct-2019 | 1,038 | $474 | |
| 145 7287 140 STREET | $499,999 | $508,100 | -1.59 | $529,800 | 03-Sep-2019 | 1983 | 09-Oct-2019 | 1,386 | $360 | |
| 23 19330 69 AVENUE | $518,000 | $594,000 | -12.79 | $549,000 | 13-Sep-2019 | 2007 | 09-Oct-2019 | 1,510 | $343 | |
| 138 16275 15 AVENUE | $603,500 | $687,000 | -12.15 | $648,000 | 08-Jul-2019 | 1990 | 10-Oct-2019 | 1,834 | $329 | |
| 40 14838 61 AVENUE | $555,000 | $552,000 | 0.54 | $568,800 | 08-Oct-2019 | 2011 | 10-Oct-2019 | 1,308 | $424 | |
| 2 16518 24A AVENUE | $649,000 | $615,000 | 5.53 | $679,900 | 19-Jul-2019 | 2016 | 10-Oct-2019 | 1,637 | $396 | |
| 35 16127 87 AVENUE | $580,000 | $556,000 | 4.32 | $619,900 | 16-Sep-2019 | 2016 | 10-Oct-2019 | 1,359 | $426 | |
| 132 16335 14 AVENUE | $687,000 | $695,000 | -1.15 | $694,000 | 16-Sep-2019 | 1989 | 10-Oct-2019 | 1,909 | $359 | Renovated/updated. |
| 89 7955 122 STREET | $573,500 | $627,000 | -8.53 | $618,000 | 25-Jun-2019 | 1989 | 10-Oct-2019 | 2,009 | $285 | |
| 13 16888 80 AVENUE | $680,000 | $653,000 | 4.13 | $799,800 | 07-May-2019 | 1995 | 11-Oct-2019 | 2,564 | $265 | |
| 42 15550 89 AVENUE | $499,000 | $496,200 | 0.56 | $549,000 | 23-Jun-2019 | 1986 | 11-Oct-2019 | 1,621 | $307 | Renovated/updated. |
| 10 16789 60 AVENUE | $595,000 | $597,000 | -0.34 | $618,800 | 21-Aug-2019 | 2005 | 11-Oct-2019 | 1,650 | $360 | |
| 18608 65 AVENUE | $660,000 | $591,000 | 11.68 | $699,000 | 11-Sep-2019 | 1998 | 11-Oct-2019 | 1,940 | $340 | Renovated/updated. |
| 7 10892 152 STREET | $475,000 | $473,800 | 0.25 | $475,000 | 19-Sep-2019 | 1971 | 11-Oct-2019 | 1,657 | $286 | Renovated/updated. |
| 6082 E GREENSIDE DRIVE | $454,000 | $405,700 | 11.91 | $469,900 | 09-Aug-2019 | 1978 | 12-Oct-2019 | 1,056 | $429 | |
| 39 15399 GUILDFORD DRIVE | $580,000 | $595,000 | -2.52 | $613,000 | 05-Jun-2019 | 2011 | 12-Oct-2019 | 1,483 | $391 | |
| 3 2738 158 STREET | $750,000 | $774,000 | -3.10 | $728,000 | 29-Jun-2016 | 2008 | 12-Oct-2019 | 2,056 | $364 | |
| 43 19159 WATKINS DRIVE | $510,000 | $513,000 | -0.58 | $524,900 | 04-Sep-2019 | 2015 | 12-Oct-2019 | 1,212 | $420 | |
| 62 7156 144 STREET | $600,000 | $603,000 | -0.50 | $649,000 | 28-May-2018 | 2009 | 12-Oct-2019 | 1,700 | $352 | |
| 205 9987 BARNSTON DRIVE | $697,000 | $708,000 | -1.55 | $729,000 | 03-Jun-2019 | 2016 | 12-Oct-2019 | 2,068 | $337 | |
| 1797 LILAC DRIVE | $515,000 | $563,000 | -8.53 | $599,400 | 10-Sep-2019 | 1979 | 12-Oct-2019 | 1,896 | $271 | Renovated/updated. |
| 44 6450 187 STREET | $520,000 | $508,000 | 2.36 | $524,900 | 08-Oct-2019 | 2012 | 12-Oct-2019 | 1,189 | $437 | Renovated/updated. |
| 70 6852 193 STREET | $540,000 | $542,000 | -0.37 | $545,000 | 10-Oct-2019 | 2006 | 12-Oct-2019 | 1,371 | $393 | Renovated/updated. |
| 17 9324 128 STREET | $545,000 | $485,800 | 12.19 | $549,000 | 18-Jul-2019 | 1973 | 13-Oct-2019 | 1,626 | $335 | Renovated/updated. |
| 94 8888 151 STREET | $646,000 | $642,000 | 0.62 | $659,999 | 02-Oct-2019 | 2000 | 14-Oct-2019 | 1,483 | $435 | Renovated/updated. |
| 170 10077 156 STREET | $500,000 | $512,400 | -2.42 | $519,800 | 02-Oct-2019 | 1987 | 14-Oct-2019 | 1,721 | $290 | Renovated/updated. |
| 6 5888 144 STREET | $575,000 | $606,000 | -5.12 | $629,000 | 15-Jul-2019 | 2014 | 14-Oct-2019 | 1,550 | $370 | |
| 15 16357 15 AVENUE | $685,000 | $708,000 | -3.25 | $699,000 | 23-Sep-2019 | 2018 | 15-Oct-2019 | 1,651 | $414 | |
| 31 16357 15 AVENUE | $635,000 | $707,000 | -10.18 | $729,888 | 19-Nov-2018 | 2018 | 15-Oct-2019 | 1,700 | $373 | |
| 14 13670 84 AVENUE | $469,900 | $487,000 | -3.51 | $469,900 | 24-Sep-2019 | 1993 | 15-Oct-2019 | 1,300 | $361 | Renovated/updated. |
| 23 12730 66 AVENUE | $545,000 | $533,000 | 2.25 | $569,000 | 23-Sep-2019 | 2005 | 15-Oct-2019 | 1,407 | $387 | |
| 123 15152 62A AVENUE | $567,900 | $592,000 | -4.07 | $679,900 | 09-Jul-2018 | 2005 | 16-Oct-2019 | 1,422 | $399 | |
| 65 16488 64 AVENUE | $590,000 | $656,000 | -10.06 | $599,000 | 27-Sep-2019 | 2016 | 16-Oct-2019 | 1,474 | $400 | |
| 118 12711 64 AVENUE | $495,000 | $506,000 | -2.17 | $499,900 | 13-Sep-2019 | 2005 | 16-Oct-2019 | 1,345 | $368 | |
| 3 2469 164 STREET | $747,500 | $750,000 | -0.33 | $799,900 | 05-Sep-2019 | 2012 | 16-Oct-2019 | 1,800 | $415 | |
| 103 6082 W BOUNDARY DRIVE | $618,000 | $667,000 | -7.35 | $649,900 | 17-May-2019 | 1986 | 16-Oct-2019 | 1,801 | $343 | |
| 48 13886 62 AVENUE | $575,000 | $573,000 | 0.35 | $600,000 | 07-Oct-2019 | 2013 | 17-Oct-2019 | 1,453 | $395 | |
| 204 13870 102 AVENUE | $300,000 | $370,300 | -18.98 | $325,000 | 07-Aug-2019 | 1984 | 17-Oct-2019 | 1,393 | $215 | |
| 101 12123 78 AVENUE | $517,000 | $479,000 | 7.93 | $549,000 | 21-Nov-2018 | 1990 | 17-Oct-2019 | 1,258 | $410 | Renovated/updated. |
| 18 8289 121A STREET | $583,800 | $668,000 | -12.60 | $635,000 | 20-Aug-2019 | 1998 | 18-Oct-2019 | 1,911 | $305 | |
| 4 18088 8 AVENUE | $800,000 | $996,000 | -19.68 | $888,888 | 01-May-2019 | 2001 | 18-Oct-2019 | 1,943 | $411 | |
| 2 15273 24 AVENUE | $610,000 | $738,000 | -17.34 | $649,000 | 17-May-2019 | 1991 | 18-Oct-2019 | 1,745 | $349 | |
| 29 8428 VENTURE WAY | $628,000 | $645,000 | -2.64 | $672,888 | 17-Sep-2018 | 1993 | 18-Oct-2019 | 1,691 | $371 | Renovated/updated. |
| 23 8277 161 STREET | $555,000 | $546,000 | 1.65 | $595,000 | 13-May-2019 | 2011 | 18-Oct-2019 | 1,410 | $393 | |
| 7 8633 159 STREET | $535,000 | $539,000 | -0.74 | $578,000 | 04-Sep-2019 | 2007 | 18-Oct-2019 | 1,453 | $368 | |
| 70 8130 136A STREET | $625,000 | $630,000 | -0.79 | $618,000 | 05-Sep-2019 | 2016 | 19-Oct-2019 | 1,528 | $409 | |
| 71 17555 57A AVENUE | $458,000 | $501,000 | -8.58 | $459,900 | 16-Oct-2019 | 2018 | 19-Oct-2019 | 990 | $462 | |
| 29 15405 31 AVENUE | $537,000 | $558,000 | -3.76 | $589,900 | 01-May-2019 | 2011 | 19-Oct-2019 | 1,367 | $392 | Renovated/updated. |
| 86 16222 23A AVENUE | $525,000 | $541,000 | -2.96 | $558,000 | 09-Aug-2019 | 2012 | 19-Oct-2019 | 1,465 | $358 | |
| 6 16361 23A AVENUE | $555,000 | $587,000 | -5.45 | $593,800 | 26-Mar-2019 | 2018 | 19-Oct-2019 | 1,321 | $420 | |
| 67 15968 82 AVENUE | $600,000 | $601,000 | -0.17 | $629,000 | 07-Oct-2019 | 2002 | 19-Oct-2019 | 1,474 | $407 | Renovated/updated. |
| 22 19250 65 AVENUE | $555,000 | $537,000 | 3.35 | $549,900 | 17-Oct-2019 | 2005 | 19-Oct-2019 | 1,360 | $408 | Renovated/updated. |
| 6 2958 159 STREET | $725,000 | $755,000 | -3.97 | $825,000 | 06-Aug-2019 | 2016 | 19-Oct-2019 | 1,830 | $396 | Renovated/updated. |
| 109 14833 61 AVENUE | $512,500 | $530,000 | -3.30 | $539,900 | 31-Dec-2018 | 2013 | 19-Oct-2019 | 1,222 | $419 | |
| 6217 E GREENSIDE DRIVE | $436,500 | $406,200 | 7.46 | $449,900 | 09-Sep-2019 | 1978 | 20-Oct-2019 | 1,058 | $412 | Renovated/updated. |
| 12 14450 68 AVENUE | $570,000 | $607,000 | -6.10 | $575,000 | 01-Oct-2019 | 2016 | 20-Oct-2019 | 1,323 | $430 | |
| 24 16388 85 AVENUE | $525,000 | $548,000 | -4.20 | $529,900 | 03-Sep-2019 | 2001 | 20-Oct-2019 | 1,490 | $352 | |
| 22 2845 156 STREET | $605,000 | $663,000 | -8.75 | $629,000 | 20-Aug-2019 | 2013 | 20-Oct-2019 | 1,600 | $378 | |
| 47 1725 SOUTHMERE CRESCENT | $899,000 | $829,000 | 8.44 | $989,000 | 03-May-2019 | 1981 | 21-Oct-2019 | 2,193 | $409 | |
| 19 18839 69 AVENUE | $540,000 | $554,000 | -2.53 | $555,000 | 17-Sep-2019 | 2005 | 22-Oct-2019 | 1,480 | $364 | Renovated/updated. |
| 17 5957 152 STREET | $575,000 | $602,000 | -4.49 | $609,000 | 28-Jan-2019 | 2013 | 22-Oct-2019 | 1,381 | $416 | |
| 29 14968 24 AVENUE | $940,000 | $1,013,000 | -7.21 | $988,000 | 18-Sep-2019 | 2001 | 22-Oct-2019 | 2,151 | $437 | |
| 10634 HOLLY PARK LANE | $355,000 | $377,400 | -5.94 | $400,000 | 16-Sep-2019 | 1977 | 23-Oct-2019 | 1,046 | $339 | |
| 23 14655 32 AVENUE | $1,060,000 | $1,034,000 | 2.51 | $1,150,000 | 12-Jun-2019 | 2007 | 23-Oct-2019 | 3,379 | $313 | |
| 4 19250 65 AVENUE | $537,000 | $538,000 | -0.19 | $549,900 | 26-Sep-2019 | 2005 | 24-Oct-2019 | 1,387 | $387 | |
| 42 16789 60 AVENUE | $487,000 | $487,000 | 0.00 | $489,900 | 21-Oct-2019 | 2005 | 24-Oct-2019 | 1,242 | $392 | |
| 26 14888 24 AVENUE | $915,000 | $795,000 | 15.09 | $899,800 | 22-Oct-2019 | 1994 | 25-Oct-2019 | 1,724 | $530 | Renovated/updated. |
53 out of 78 sold below assessed with a median sold price of -2.30
Port Moody
| Address | Sold Price | Assessed | % Δ | True List Price | True List Date | Year Built | Sold Date | Sqft | Price per sqft | Notes |
|---|---|---|---|---|---|---|---|---|---|---|
| 39 101 FRASER STREET | $740,000 | $784,000 | -5.61 | $750,000 | 20-Nov-2017 | 2007 | 07-Oct-2019 | 1,414 | $523 | |
| 1 2305 ST JOHNS STREET | $585,000 | $582,000 | 0.52 | $588,800 | 07-Oct-2019 | 1993 | 13-Oct-2019 | 1,143 | $511 | |
| 945 BLACKSTOCK ROAD | $540,000 | $560,900 | -3.73 | $559,900 | 02-Oct-2019 | 1977 | 16-Oct-2019 | 1,030 | $524 | Renovated/updated. |
| 122 BROOKSIDE DRIVE | $678,000 | $692,600 | -2.11 | $688,000 | 15-Oct-2019 | 1973 | 20-Oct-2019 | 1,635 | $414 | Renovated/updated. |
| 61 15 FOREST PARK WAY | $670,000 | $676,000 | -0.89 | $684,800 | 09-Oct-2019 | 2000 | 21-Oct-2019 | 1,260 | $531 | |
| 3 303 HIGHLAND WAY | $460,000 | $539,200 | -14.69 | $519,000 | 20-May-2019 | 1978 | 23-Oct-2019 | 870 | $528 |
5 out of 6 sold below assessed with a median sold price of -2.92
Coquitlam
| Address | Sold Price | Assessed | % Δ | True List Price | True List Date | Year Built | Sold Date | Sqft | Price per sqft | Notes |
|---|---|---|---|---|---|---|---|---|---|---|
| 204 1423 BRUNETTE AVENUE | $560,000 | $614,000 | -8.79 | $609,000 | 23-Apr-2019 | 1998 | 11-Oct-2019 | 1,251 | $447 | |
| 8 1751 PADDOCK DRIVE | $870,000 | $935,000 | -6.95 | $965,900 | 11-Mar-2019 | 1997 | 12-Oct-2019 | 2,451 | $354 | Renovated/updated. |
| 1 305 DECAIRE STREET | $640,000 | $653,600 | -2.08 | $669,000 | 06-Aug-2019 | 1974 | 12-Oct-2019 | 1,890 | $338 | Renovated/updated. |
| 2 320 DECAIRE STREET | $820,000 | $1,010,000 | -18.81 | $949,900 | 13-May-2019 | 2004 | 14-Oct-2019 | 1,732 | $473 | |
| 9 1125 KENSAL PLACE | $795,000 | $795,000 | 0.00 | $799,900 | 01-Oct-2019 | 2010 | 14-Oct-2019 | 1,451 | $547 | |
| 106 958 RIDGEWAY AVENUE | $808,000 | $814,000 | -0.74 | $799,000 | 17-Jun-2019 | 2012 | 14-Oct-2019 | 1,356 | $595 | |
| 235 1408 CARTIER AVENUE | $556,800 | $628,000 | -11.34 | $619,000 | 03-Jun-2019 | 1998 | 16-Oct-2019 | 1,245 | $447 | Renovated/updated. |
| 106 1125 KENSAL PLACE | $985,000 | $1,017,000 | -3.15 | $1,070,000 | 18-Jun-2018 | 2010 | 16-Oct-2019 | 2,022 | $487 | |
| 214 1465 PARKWAY BOULEVARD | $785,000 | $936,000 | -16.13 | $869,900 | 11-Jan-2019 | 1997 | 17-Oct-2019 | 2,216 | $354 | Renovated/updated. |
| 27 1338 HAMES CRESCENT | $682,500 | $711,000 | -4.01 | $709,999 | 22-Jul-2019 | 2012 | 17-Oct-2019 | 1,374 | $496 | |
| 37 1305 SOBALL STREET | $718,000 | $817,000 | -12.12 | $745,000 | 18-Sep-2019 | 2010 | 18-Oct-2019 | 1,385 | $518 | |
| 83 1320 RILEY STREET | $850,000 | $889,000 | -4.39 | $918,800 | 11-Jun-2019 | 2013 | 19-Oct-2019 | 1,693 | $502 | |
| 12 1140 EAGLERIDGE DRIVE | $605,000 | $601,600 | 0.57 | $596,900 | 16-Oct-2019 | 1980 | 20-Oct-2019 | 1,255 | $482 | Renovated/updated. |
| 14 3445 WILKIE AVENUE | $877,500 | $982,000 | -10.64 | $899,900 | 20-Sep-2019 | 2009 | 21-Oct-2019 | 2,109 | $416 | |
| 152 2979 PANORAMA DRIVE | $790,000 | $1,005,000 | -21.39 | $799,800 | 05-Oct-2019 | 1996 | 21-Oct-2019 | 2,828 | $279 | |
| 96 3010 RIVERBEND DRIVE | $589,900 | $618,000 | -4.55 | $584,900 | 08-Oct-2019 | 2011 | 21-Oct-2019 | 1,210 | $487 |
14 out of 15 sold below assessed with a median sold price of -6.95
Port Coquitlam
| Address | Sold Price | Assessed | % Δ | True List Price | True List Date | Year Built | Sold Date | Sqft | Price per sqft | Notes |
|---|---|---|---|---|---|---|---|---|---|---|
| 98 2450 HAWTHORNE AVENUE | $526,000 | $677,000 | -22.30 | $524,999 | 30-Sep-2019 | 1990 | 07-Oct-2019 | 1,507 | $349 | |
| 73 2428 NILE GATE | $590,000 | $638,000 | -7.52 | $618,900 | 11-Jun-2019 | 2012 | 09-Oct-2019 | 1,258 | $468 | |
| 32 2423 AVON PLACE | $600,000 | $624,000 | -3.85 | $615,450 | 25-Sep-2019 | 2012 | 12-Oct-2019 | 1,190 | $504 | |
| 17 2325 RANGER LANE | $578,000 | $589,000 | -1.87 | $599,000 | 17-Sep-2019 | 2015 | 12-Oct-2019 | 1,120 | $516 | |
| 112 2428 NILE GATE | $630,000 | $661,000 | -4.69 | $649,900 | 26-Aug-2019 | 2012 | 13-Oct-2019 | 1,284 | $490 | |
| 2520 GORDON AVENUE | $540,000 | $559,500 | -3.49 | $628,900 | 01-Oct-2018 | 1977 | 15-Oct-2019 | 1,256 | $429 | Renovated/updated. |
| 53 2310 RANGER LANE | $660,000 | $686,000 | -3.79 | $689,900 | 04-Jul-2019 | 2014 | 15-Oct-2019 | 1,285 | $513 | |
| 213 2432 WELCHER AVENUE | $475,000 | $538,000 | -11.71 | $495,900 | 22-Jul-2019 | 2004 | 20-Oct-2019 | 1,019 | $466 | |
| 129 2418 AVON PLACE | $595,000 | $660,000 | -9.85 | $648,000 | 14-Apr-2019 | 2009 | 21-Oct-2019 | 1,208 | $492 | Renovated/updated. |
| 401 1661 FRASER AVENUE | $499,900 | $501,000 | -0.22 | $499,000 | 02-Jul-2019 | 2007 | 21-Oct-2019 | 1,000 | $499 | |
| 59 1255 RIVERSIDE DRIVE | $687,500 | $798,000 | -13.85 | $695,000 | 19-Sep-2019 | 1995 | 24-Oct-2019 | 1,662 | $413 | Renovated/updated. |
11 out of 11 sold below assessed with a median sold price of -4.69
Pitt Meadows
| Address | Sold Price | Assessed | % Δ | True List Price | True List Date | Year Built | Sold Date | Sqft | Price per sqft | Notes |
|---|---|---|---|---|---|---|---|---|---|---|
| 3 19270 122A AVENUE | $670,000 | $671,000 | -0.15 | $699,900 | 07-Oct-2019 | 1994 | 11-Oct-2019 | 2,078 | $322 | |
| 59 12449 191 STREET | $481,000 | $539,000 | -10.76 | $595,900 | 06-Sep-2018 | 1996 | 19-Oct-2019 | 1,417 | $339 | Renovated/updated. |
2 out of 2 sold below assessed with a median sold price of -5.45
Langley
| Address | Sold Price | Assessed | % Δ | True List Price | True List Date | Year Built | Sold Date | Sqft | Price per sqft | Notes |
|---|---|---|---|---|---|---|---|---|---|---|
| 32 20967 76 AVENUE | $546,000 | $600,000 | -9.00 | $555,000 | 23-Sep-2019 | 2012 | 07-Oct-2019 | 1,383 | $394 | |
| 27 8930 WALNUT GROVE DRIVE | $549,000 | $498,000 | 10.24 | $569,900 | 23-May-2019 | 1995 | 07-Oct-2019 | 1,488 | $368 | Renovated/updated. |
| 27 7686 209 STREET | $652,500 | $708,000 | -7.84 | $649,000 | 10-Sep-2019 | 2014 | 08-Oct-2019 | 1,916 | $340 | |
| 136 5641 201 STREET | $420,000 | $350,000 | 20.00 | $424,900 | 27-Sep-2019 | 1988 | 08-Oct-2019 | 1,300 | $323 | Renovated/updated. |
| 201 21937 48 AVENUE | $565,000 | $477,000 | 18.45 | $579,000 | 23-Sep-2019 | 1990 | 08-Oct-2019 | 1,520 | $371 | Renovated/updated. |
| 30 20967 76 AVENUE | $544,500 | $597,000 | -8.79 | $580,000 | 29-Jul-2019 | 2012 | 09-Oct-2019 | 1,402 | $388 | |
| 21 20176 68 AVENUE | $427,000 | $439,000 | -2.73 | $429,900 | 23-Sep-2019 | 2003 | 10-Oct-2019 | 988 | $432 | Renovated/updated. |
| 41 9208 208 STREET | $710,000 | $712,000 | -0.28 | $709,900 | 10-Oct-2019 | 1993 | 10-Oct-2019 | 1,564 | $453 | Renovated/updated. |
| 75 8508 204 STREET | $522,500 | $563,000 | -7.19 | $559,000 | 03-Sep-2019 | 2017 | 10-Oct-2019 | 1,233 | $423 | |
| 103 9208 208 STREET | $778,000 | $773,000 | 0.65 | $794,500 | 05-Jul-2019 | 1993 | 11-Oct-2019 | 1,835 | $423 | |
| 138 6747 203 STREET | $497,000 | $563,000 | -11.72 | $535,000 | 13-Aug-2019 | 2005 | 12-Oct-2019 | 1,277 | $389 | Renovated/updated. |
| 34 8675 WALNUT GROVE DRIVE | $610,000 | $737,000 | -17.23 | $679,998 | 06-Aug-2019 | 1993 | 12-Oct-2019 | 2,174 | $280 | |
| 2 20761 DUNCAN WAY | $490,000 | $554,000 | -11.55 | $529,900 | 10-Jun-2019 | 2004 | 13-Oct-2019 | 1,340 | $365 | |
| 101 8138 204 STREET | $568,000 | $611,000 | -7.04 | $579,900 | 08-Oct-2019 | 2016 | 13-Oct-2019 | 1,291 | $439 | |
| 3 23230 BILLY BROWN ROAD | $751,090 | $873,000 | -13.96 | $799,800 | 13-Aug-2019 | 2012 | 16-Oct-2019 | 1,298 | $578 | |
| 44 19649 53 AVENUE | $530,000 | $602,000 | -11.96 | $599,000 | 14-May-2019 | 1990 | 16-Oct-2019 | 1,286 | $412 | |
| 21 20881 87 AVENUE | $640,000 | $632,000 | 1.27 | $639,900 | 15-Oct-2019 | 1996 | 19-Oct-2019 | 1,597 | $400 | |
| 84 20498 82 AVENUE | $580,000 | $648,000 | -10.49 | $629,900 | 16-Jul-2019 | 2016 | 20-Oct-2019 | 1,445 | $401 | |
| 7 7059 210 STREET | $802,500 | $853,000 | -5.92 | $839,900 | 24-Sep-2019 | 2015 | 20-Oct-2019 | 2,510 | $319 | |
| 1 20831 70 AVENUE | $640,000 | $665,000 | -3.76 | $649,000 | 17-Oct-2019 | 2010 | 20-Oct-2019 | 1,952 | $327 | |
| 193 20391 96 AVENUE | $710,000 | $712,000 | -0.28 | $739,900 | 10-Jul-2019 | 1992 | 21-Oct-2019 | 2,958 | $240 | |
| 39 8476 207A STREET | $551,000 | $602,000 | -8.47 | $569,000 | 25-Sep-2019 | 2016 | 21-Oct-2019 | 1,372 | $401 | |
| 6 7665 209 STREET | $615,000 | $657,000 | -6.39 | $699,800 | 27-Aug-2018 | 2016 | 21-Oct-2019 | 1,548 | $397 | |
| 74 8737 212 STREET | $599,900 | $585,000 | 2.55 | $599,900 | 28-Aug-2019 | 1989 | 21-Oct-2019 | 1,479 | $405 | Renovated/updated. |
| 26 6450 199 STREET | $472,400 | $504,000 | -6.27 | $474,900 | 15-Oct-2019 | 2002 | 21-Oct-2019 | 1,200 | $393 | |
| 107 8737 212 STREET | $645,000 | $585,000 | 10.26 | $649,900 | 16-Sep-2019 | 1989 | 22-Oct-2019 | 1,414 | $456 | Renovated/updated. |
| 33 7059 210 STREET | $599,000 | $662,000 | -9.52 | $649,000 | 24-Sep-2019 | 2015 | 23-Oct-2019 | 1,764 | $339 | |
| 31 6450 199 STREET | $579,900 | $651,000 | -10.92 | $538,800 | 20-Mar-2017 | 2002 | 27-Oct-2019 | 1,811 | $320 |
21 out of 28 sold below assessed with a median sold price of -6.72
Maple Ridge
| Address | Sold Price | Assessed | % Δ | True List Price | True List Date | Year Built | Sold Date | Sqft | Price per sqft | Notes |
|---|---|---|---|---|---|---|---|---|---|---|
| 25 11305 240 STREET | $518,000 | $558,000 | -7.17 | $529,900 | 02-Oct-2019 | 2015 | 09-Oct-2019 | 1,439 | $359 | |
| 2 21960 RIVER ROAD | $437,500 | $429,000 | 1.98 | $445,000 | 03-Oct-2019 | 1993 | 09-Oct-2019 | 1,145 | $382 | Renovated/updated. |
| 10 11490 232 STREET | $530,500 | $597,000 | -11.14 | $539,800 | 09-Sep-2019 | 1998 | 09-Oct-2019 | 1,735 | $305 | |
| 14 11757 236 STREET | $459,900 | $489,000 | -5.95 | $454,900 | 09-Oct-2019 | 1995 | 11-Oct-2019 | 1,308 | $351 | Renovated/updated. |
| 42 20841 DEWDNEY TRUNK ROAD | $561,500 | $594,000 | -5.47 | $538,800 | 23-Sep-2019 | 1993 | 11-Oct-2019 | 1,700 | $330 | Renovated/updated. |
| 10 23560 119 AVENUE | $390,000 | $381,000 | 2.36 | $399,000 | 03-Oct-2019 | 1996 | 11-Oct-2019 | 1,010 | $386 | |
| 10 11757 236 STREET | $482,500 | $490,000 | -1.53 | $499,900 | 28-Sep-2019 | 1995 | 12-Oct-2019 | 1,310 | $368 | |
| 10 11536 236 STREET | $520,000 | $542,000 | -4.06 | $539,000 | 16-Sep-2019 | 1994 | 14-Oct-2019 | 1,582 | $328 | Renovated/updated. |
| 7 11848 LAITY STREET | $470,000 | $479,000 | -1.88 | $500,000 | 26-Sep-2019 | 1987 | 18-Oct-2019 | 1,632 | $287 | Renovated/updated. |
| 16 21555 DEWDNEY TRUNK ROAD | $202,680 | $184,600 | 9.79 | $210,000 | 03-Oct-2019 | 1970 | 19-Oct-2019 | 550 | $368 | Renovated/updated. |
7 out of 10 sold below assessed with a median sold price of -2.97