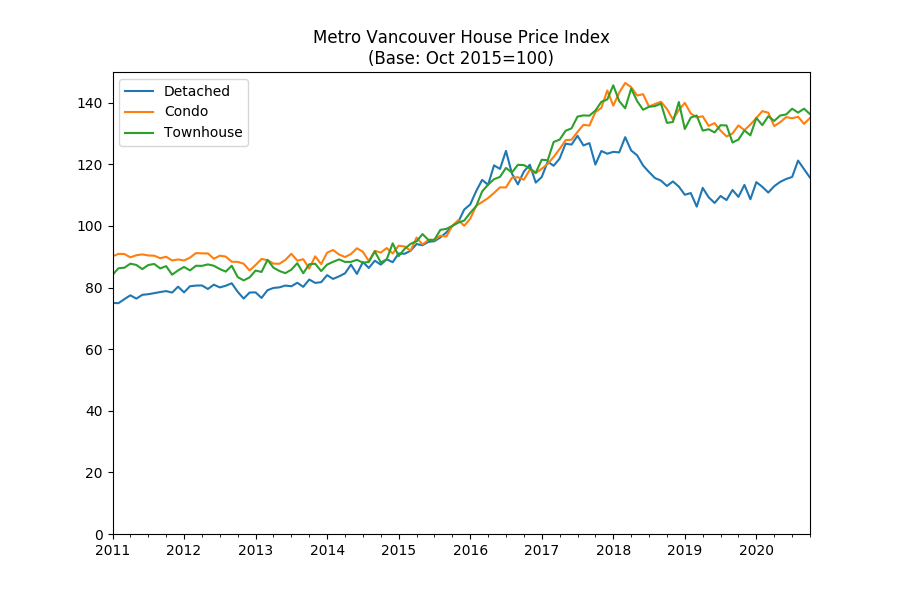
Metro Vancouver townhouse prices are receding from the peak reached in September as buyers sought as buyers rushed to by affordable townhouses with more space to accommodate working from home arrangement during Covid-19 lockdowns.
The OpenHousing Home Price Index for townhouse properties – calculated using the generally-accepted and transparent repeat sales or Case-Shiller method1 – increased by 6.46% year-over-year, the October mid-month projection shows.
This represents a 1.28% month-over-month decrease.
Here’s what townhouse sales looked like in the last 30 days.
Vancouver
| Address | Sold Price | Assessed | % Δ | True List Price | True List Date | Year Built | Sold Date | Sqft | Price per sqft | Notes |
|---|---|---|---|---|---|---|---|---|---|---|
| 19 2713 E KENT AVENUE NORTH | $562,500 | $506,000 | 11.17 | $585,000 | 10-Sep-2020 | 1995 | 24-Sep-2020 | 956 | $588 | |
| 1835 W 12TH AVENUE | $1,222,000 | $1,046,000 | 16.83 | $1,288,000 | 11-Aug-2020 | 1929 | 24-Sep-2020 | 1,682 | $726 | Renovated/updated. |
| 6 6262 ASH STREET | $1,350,000 | $1,434,000 | -5.86 | $1,638,000 | 07-Jul-2020 | 1998 | 24-Sep-2020 | 1,743 | $774 | Renovated/updated. |
| 6090 OAK STREET | $1,595,000 | $1,552,000 | 2.77 | $1,799,000 | 14-Aug-2019 | 2016 | 25-Sep-2020 | 1,847 | $863 | |
| 228 E 30TH AVENUE | $693,000 | $646,000 | 7.28 | $685,000 | 24-Sep-2020 | 2012 | 25-Sep-2020 | 750 | $924 | |
| 8 1266 W 6TH AVENUE | $818,000 | $779,000 | 5.01 | $879,000 | 17-Aug-2020 | 1981 | 26-Sep-2020 | 1,074 | $761 | Renovated/updated. |
| 805 FERRY ROW | $875,000 | $1,215,000 | -27.98 | $899,000 | 14-Sep-2020 | 1976 | 27-Sep-2020 | 1,383 | $632 | Renovated/updated. |
| 17 5879 GRAY AVENUE | $2,096,000 | $2,035,000 | 3.00 | $2,260,000 | 18-Feb-2020 | 2009 | 28-Sep-2020 | 2,379 | $881 | |
| 10 1214 W 7TH AVENUE | $1,295,000 | $1,329,000 | -2.56 | $1,350,000 | 30-Jul-2020 | 1980 | 28-Sep-2020 | 2,269 | $570 | Renovated/updated. |
| 2774 ALMA STREET | $1,095,000 | $955,000 | 14.66 | $1,099,000 | 23-Sep-2020 | 2004 | 28-Sep-2020 | 1,074 | $1,019 | Renovated/updated. |
| 27 1350 W 6TH AVENUE | $775,000 | $772,000 | 0.39 | $749,000 | 25-Sep-2020 | 1987 | 29-Sep-2020 | 828 | $935 | Renovated/updated. |
| 2411 W 5TH AVENUE | $1,327,000 | $963,400 | 37.74 | $1,339,000 | 21-Sep-2020 | 1979 | 29-Sep-2020 | 1,231 | $1,077 | Renovated/updated. |
| 830 W 15TH AVENUE | $1,510,000 | $1,336,000 | 13.02 | $1,499,000 | 21-Sep-2020 | 2001 | 29-Sep-2020 | 1,452 | $1,039 | |
| 340 W 62ND AVENUE | $1,790,000 | $1,605,000 | 11.53 | $1,980,000 | 28-Jun-2017 | 2017 | 30-Sep-2020 | 1,796 | $996 | Renovated/updated. |
| 75 3426 TERRA VITA PLACE | $860,000 | $750,000 | 14.67 | $869,000 | 23-Sep-2020 | 1997 | 30-Sep-2020 | 1,342 | $640 | Renovated/updated. |
| 107 3753 W 10TH AVENUE | $850,000 | $747,000 | 13.79 | $843,000 | 24-Sep-2020 | 1989 | 30-Sep-2020 | 976 | $870 | |
| 110 5958 IONA DRIVE | $1,468,000 | $1,320,000 | 11.21 | $1,688,000 | 18-Jul-2019 | 2006 | 01-Oct-2020 | 2,219 | $661 | |
| 83 4900 CARTIER STREET | $2,998,000 | $1,949,000 | 53.82 | $3,095,000 | 08-Sep-2020 | 1981 | 01-Oct-2020 | 2,699 | $1,110 | |
| 856 W 6TH AVENUE | $1,220,000 | $1,259,000 | -3.10 | $1,258,000 | 22-Jul-2019 | 2005 | 02-Oct-2020 | 1,417 | $860 | |
| 2832 E KENT AVENUE SOUTH | $752,000 | $716,000 | 5.03 | $788,000 | 21-Sep-2020 | 1995 | 02-Oct-2020 | 1,305 | $576 | |
| 2038 W 15TH AVENUE | $1,400,000 | $1,331,000 | 5.18 | $1,239,000 | 11-Jun-2013 | 2004 | 03-Oct-2020 | 1,421 | $985 | |
| 1688 MCLEAN DRIVE | $1,151,000 | $1,111,000 | 3.60 | $1,189,000 | 16-Sep-2020 | 2016 | 04-Oct-2020 | 1,466 | $785 | |
| 4 1063 W 7TH AVENUE | $1,375,000 | $1,141,700 | 20.43 | $1,449,000 | 24-Aug-2020 | 1978 | 05-Oct-2020 | 1,993 | $689 | Renovated/updated. |
| 106 1318 W 6TH AVENUE | $1,100,000 | $898,000 | 22.49 | $925,000 | 29-Sep-2020 | 1992 | 05-Oct-2020 | 1,138 | $966 | Renovated/updated. |
| 7268 WEAVER COURT | $742,500 | $644,000 | 15.30 | $744,900 | 25-Sep-2020 | 1979 | 05-Oct-2020 | 1,716 | $432 | Renovated/updated. |
| 718 UNION STREET | $1,317,000 | $1,299,000 | 1.39 | $1,299,000 | 28-Sep-2020 | 2006 | 06-Oct-2020 | 1,636 | $805 | |
| 3862 WELWYN STREET | $1,259,000 | $1,154,000 | 9.10 | $1,259,000 | 29-Sep-2020 | 2006 | 06-Oct-2020 | 1,614 | $780 | |
| 1871 STAINSBURY AVENUE | $725,500 | $667,000 | 8.77 | $699,900 | 28-Sep-2020 | 2008 | 06-Oct-2020 | 726 | $999 | |
| 6336 ASH STREET | $1,500,000 | $1,621,000 | -7.46 | $1,199,000 | 20-Dec-2010 | 2011 | 06-Oct-2020 | 1,515 | $990 | |
| 220 678 W 7TH AVENUE | $525,000 | $446,700 | 17.53 | $539,900 | 09-Sep-2020 | 1998 | 06-Oct-2020 | 526 | $998 | |
| 333 E 7TH AVENUE | $1,130,000 | $1,227,000 | -7.91 | $1,148,000 | 29-Sep-2020 | 2015 | 06-Oct-2020 | 1,341 | $842 | |
| 2 2188 W 8TH AVENUE | $1,415,000 | $1,366,000 | 3.59 | $1,368,000 | 08-Mar-2016 | 2008 | 06-Oct-2020 | 1,477 | $958 | |
| 3750 COMMERCIAL STREET | $999,999 | $1,043,000 | -4.12 | $1,068,000 | 15-Sep-2020 | 2006 | 06-Oct-2020 | 1,271 | $786 | |
| 1973 W 13TH AVENUE | $1,320,000 | $1,012,000 | 30.43 | $1,398,000 | 15-Sep-2020 | 1912 | 06-Oct-2020 | 1,400 | $942 | |
| 2937 WALL STREET | $1,180,000 | $1,132,000 | 4.24 | $1,178,000 | 28-Sep-2020 | 2012 | 06-Oct-2020 | 1,415 | $833 | Renovated/updated. |
| 3 1540 GRANT STREET | $1,015,000 | $895,000 | 13.41 | ? | 04-Sep-2013 | 2013 | 07-Oct-2020 | 1,125 | $902 | |
| 6 2883 E KENT AVENUE NORTH AVENUE | $530,000 | $472,000 | 12.29 | $560,000 | 09-Sep-2020 | 1993 | 07-Oct-2020 | 946 | $560 | |
| 715 W 7TH AVENUE | $998,000 | $1,071,000 | -6.82 | $988,000 | 21-Sep-2020 | 1988 | 07-Oct-2020 | 1,075 | $928 | Renovated/updated. |
| 530 W 7TH AVENUE | $915,000 | $1,012,000 | -9.58 | $999,000 | 10-Mar-2020 | 2014 | 08-Oct-2020 | 1,023 | $894 | |
| 466 E 5TH AVENUE | $950,000 | $836,000 | 13.64 | $1,099,000 | 20-Jul-2020 | 2010 | 09-Oct-2020 | 1,193 | $796 | |
| 101 1860 W 6TH AVENUE | $830,000 | $892,000 | -6.95 | $925,000 | 15-Apr-2019 | 1989 | 09-Oct-2020 | 1,084 | $765 | Renovated/updated. |
| 7 2389 CHARLES STREET | $850,000 | $705,000 | 20.57 | $759,000 | 09-Oct-2020 | 2004 | 10-Oct-2020 | 1,036 | $820 | Renovated/updated. |
| 1847 CHARLES STREET | $1,170,000 | $1,045,000 | 11.96 | $1,199,990 | 05-Oct-2020 | 2013 | 12-Oct-2020 | 1,247 | $938 | Renovated/updated. |
| 742 JACKSON AVENUE | $1,285,000 | $1,008,000 | 27.48 | $1,198,000 | 05-Oct-2020 | 1906 | 13-Oct-2020 | 1,465 | $877 | |
| 1 46 W 12TH AVENUE | $875,000 | $677,000 | 29.25 | $850,000 | 06-Oct-2020 | 1995 | 13-Oct-2020 | 775 | $1,129 | Renovated/updated. |
| 2110 TRIUMPH STREET | $765,000 | $675,000 | 13.33 | $699,000 | 05-Oct-2020 | 2004 | 13-Oct-2020 | 1,153 | $663 | Renovated/updated. |
| 876 W 15TH AVENUE | $1,605,000 | $1,440,000 | 11.46 | $1,528,000 | 06-Oct-2020 | 2001 | 14-Oct-2020 | 1,398 | $1,148 | Renovated/updated. |
| 972 W 54TH AVENUE | $1,460,000 | $1,207,000 | 20.96 | ? | 04-Jun-2012 | 1999 | 17-Oct-2020 | 1,970 | $741 | Renovated/updated. |
| 3435 WEYMOOR PLACE | $651,000 | $613,000 | 6.20 | $599,900 | 15-Oct-2020 | 1982 | 18-Oct-2020 | 1,270 | $512 |
5 out of 27 unrenovated resale homes sold below assessed with a median sold price of 7.28
Richmond
| Address | Sold Price | Assessed | % Δ | True List Price | True List Date | Year Built | Sold Date | Sqft | Price per sqft | Notes |
|---|---|---|---|---|---|---|---|---|---|---|
| 27 5740 GARRISON ROAD | $793,000 | $747,000 | 6.16 | $818,000 | 14-Sep-2020 | 1985 | 26-Sep-2020 | 1,648 | $481 | Renovated/updated. |
| 3 9731 CAPELLA DRIVE | $795,000 | $694,000 | 14.55 | $798,900 | 08-Sep-2020 | 1989 | 27-Sep-2020 | 1,706 | $466 | Renovated/updated. |
| 4 4588 DUBBERT STREET | $708,000 | $668,000 | 5.99 | $799,000 | 25-Jun-2020 | 2016 | 28-Sep-2020 | 1,150 | $615 | |
| 20 9211 MCKIM WAY | $899,000 | $878,000 | 2.39 | $899,000 | 25-Feb-2020 | 2019 | 29-Sep-2020 | 1,333 | $674 | |
| 44 6300 ALDER STREET | $900,000 | $907,000 | -0.77 | $939,800 | 09-Sep-2020 | 2002 | 29-Sep-2020 | 1,491 | $603 | |
| 50 10080 KILBY DRIVE | $733,000 | $653,000 | 12.25 | ? | 11-Nov-2014 | 1994 | 30-Sep-2020 | 1,302 | $562 | Renovated/updated. |
| 17 8651 GENERAL CURRIE ROAD | $713,000 | $684,000 | 4.24 | $748,000 | 31-Jul-2020 | 1989 | 30-Sep-2020 | 1,480 | $481 | Renovated/updated. |
| 6 5700 DOVER CRESCENT | $925,000 | $894,000 | 3.47 | $888,000 | 25-Sep-2020 | 1995 | 01-Oct-2020 | 1,571 | $588 | |
| 7 7411 MOFFATT ROAD | $1,056,000 | $1,227,000 | -13.94 | ? | 27-Feb-2015 | 2014 | 01-Oct-2020 | 1,453 | $726 | |
| 13 11100 RAILWAY AVENUE | $1,171,000 | $966,000 | 21.22 | $1,248,000 | 06-Aug-2019 | 1988 | 02-Oct-2020 | 1,965 | $595 | Renovated/updated. |
| 57 5531 CORNWALL DRIVE | $1,282,800 | $1,183,000 | 8.44 | $1,390,000 | 15-Jul-2020 | 1992 | 03-Oct-2020 | 2,359 | $543 | Renovated/updated. |
| 3 9311 DAYTON AVENUE | $955,000 | $831,000 | 14.92 | $899,000 | 30-Sep-2020 | 1989 | 03-Oct-2020 | 1,953 | $488 | Renovated/updated. |
| 44 6871 FRANCIS ROAD | $679,000 | $650,500 | 4.38 | $689,000 | 09-Sep-2020 | 1977 | 04-Oct-2020 | 1,596 | $425 | |
| 115 2211 NO. 4 ROAD | $680,000 | $526,000 | 29.28 | $668,000 | 28-Sep-2020 | 1993 | 05-Oct-2020 | 1,285 | $529 | Renovated/updated. |
| 37 9651 DAYTON AVENUE | $975,000 | $934,000 | 4.39 | $998,000 | 09-Sep-2019 | 1984 | 05-Oct-2020 | 1,917 | $508 | Renovated/updated. |
| 5 6033 WILLIAMS ROAD | $866,000 | $869,000 | -0.35 | $898,000 | 23-Jun-2020 | 2015 | 05-Oct-2020 | 1,300 | $666 | |
| 12 8051 ASH STREET | $1,054,000 | $981,000 | 7.44 | $968,000 | 28-Sep-2020 | 1990 | 05-Oct-2020 | 2,151 | $490 | Renovated/updated. |
| 11 7420 MOFFATT ROAD | $888,000 | $840,000 | 5.71 | $929,000 | 11-Aug-2020 | 2003 | 05-Oct-2020 | 1,505 | $590 | Renovated/updated. |
| 1 8751 BENNETT ROAD | $830,000 | $768,100 | 8.06 | $850,000 | 01-Oct-2020 | 1986 | 06-Oct-2020 | 1,722 | $481 | Renovated/updated. |
| 3 6431 COONEY ROAD | $620,000 | $601,500 | 3.08 | $788,000 | 06-Aug-2020 | 1984 | 06-Oct-2020 | 1,243 | $498 | Renovated/updated. |
| 60 5531 CORNWALL DRIVE | $1,045,000 | $906,000 | 15.34 | ? | 28-Jun-2012 | 1992 | 07-Oct-2020 | 1,882 | $555 | Renovated/updated. |
| 48 3851 BLUNDELL ROAD | $686,000 | $578,300 | 18.62 | $688,800 | 08-Oct-2020 | 1976 | 08-Oct-2020 | 1,330 | $515 | |
| 15 3071 SPRINGFIELD DRIVE | $750,000 | $599,500 | 25.10 | $758,000 | 22-Sep-2020 | 1970 | 08-Oct-2020 | 1,357 | $552 | Renovated/updated. |
| 45 4700 FRANCIS ROAD | $649,000 | $587,600 | 10.45 | $649,000 | 05-Oct-2020 | 1978 | 09-Oct-2020 | 1,153 | $562 | |
| 1 8311 FRANCIS ROAD | $825,000 | $741,000 | 11.34 | $895,000 | 18-Jun-2020 | 1989 | 10-Oct-2020 | 1,621 | $508 | |
| 23 8291 GENERAL CURRIE ROAD | $850,000 | $801,000 | 6.12 | $899,900 | 06-Oct-2020 | 1989 | 10-Oct-2020 | 1,797 | $473 | Renovated/updated. |
| 3 22571 WESTMINSTER HIGHWAY | $700,100 | $649,000 | 7.87 | $599,000 | 05-Oct-2020 | 2005 | 13-Oct-2020 | 1,334 | $524 | |
| 8 11451 KINGFISHER DRIVE | $795,100 | $692,000 | 14.90 | $778,000 | 08-Oct-2020 | 1971 | 13-Oct-2020 | 1,414 | $562 | Renovated/updated. |
3 out of 10 unrenovated resale homes sold below assessed with a median sold price of 5.18
Burnaby
| Address | Sold Price | Assessed | % Δ | True List Price | True List Date | Year Built | Sold Date | Sqft | Price per sqft | Notes |
|---|---|---|---|---|---|---|---|---|---|---|
| 19 3379 MORREY COURT | $820,000 | $810,000 | 1.23 | $868,000 | 01-Sep-2020 | 2005 | 24-Sep-2020 | 1,300 | $630 | |
| 23 5240 OAKMOUNT CRESCENT | $1,100,000 | $977,000 | 12.59 | $1,090,000 | 21-Sep-2020 | 1996 | 24-Sep-2020 | 1,861 | $591 | Renovated/updated. |
| 32 7488 MULBERRY PLACE | $900,000 | $822,000 | 9.49 | $899,900 | 22-Sep-2020 | 1998 | 24-Sep-2020 | 1,992 | $451 | |
| 109 368 ELLESMERE AVENUE | $678,000 | $582,000 | 16.49 | $649,900 | 21-Sep-2020 | 2009 | 26-Sep-2020 | 928 | $730 | |
| 21 7501 CUMBERLAND STREET | $834,450 | $794,000 | 5.09 | $849,900 | 12-Aug-2020 | 1993 | 26-Sep-2020 | 1,769 | $471 | |
| 1902 GOLETA DRIVE | $560,000 | $551,900 | 1.47 | $588,000 | 12-Aug-2020 | 1973 | 26-Sep-2020 | 1,245 | $449 | Renovated/updated. |
| 2895 CORONA DRIVE | $898,000 | $718,500 | 24.98 | $888,000 | 16-Jun-2020 | 1972 | 27-Sep-2020 | 2,216 | $405 | |
| 4225 BIRCHWOOD CRESCENT | $890,000 | $748,600 | 18.89 | $899,000 | 23-Sep-2020 | 1976 | 27-Sep-2020 | 1,724 | $516 | Renovated/updated. |
| 201 5211 IRMIN STREET | $620,000 | $572,000 | 8.39 | $649,000 | 22-Jun-2018 | 2009 | 27-Sep-2020 | 825 | $751 | |
| 7 7428 SOUTHWYNDE AVENUE | $660,000 | $634,000 | 4.10 | $669,000 | 06-Aug-2020 | 2005 | 28-Sep-2020 | 1,045 | $631 | Renovated/updated. |
| 63 6588 SOUTHOAKS CRESCENT | $430,000 | $415,500 | 3.49 | $449,900 | 20-Aug-2020 | 1997 | 29-Sep-2020 | 728 | $590 | |
| 8161 FOREST GROVE DRIVE | $699,000 | $719,000 | -2.78 | $699,000 | 25-Sep-2020 | 1984 | 01-Oct-2020 | 1,977 | $353 | |
| 3 5142 CANADA WAY | $810,000 | $759,000 | 6.72 | $829,900 | 13-Jul-2020 | 2018 | 02-Oct-2020 | 1,158 | $699 | |
| 95 6588 SOUTHOAKS CRESCENT | $596,000 | $462,000 | 29.00 | $628,000 | 15-Apr-2019 | 1997 | 02-Oct-2020 | 857 | $695 | |
| 19 7433 16TH STREET | $723,000 | $748,000 | -3.34 | $739,000 | 04-Aug-2020 | 1994 | 02-Oct-2020 | 1,352 | $534 | Renovated/updated. |
| 14 6539 ELGIN AVENUE | $825,000 | $744,000 | 10.89 | $849,000 | 21-Aug-2020 | 2003 | 02-Oct-2020 | 1,339 | $616 | |
| 210 4458 ALBERT STREET | $765,000 | $711,000 | 7.59 | $769,900 | 30-Sep-2020 | 2004 | 03-Oct-2020 | 1,122 | $681 | |
| 1 5108 CLAUDE AVENUE | $940,000 | $988,000 | -4.86 | $998,000 | 03-Jun-2020 | 2016 | 04-Oct-2020 | 1,300 | $723 | Renovated/updated. |
| 307 3709 PENDER STREET | $668,000 | $572,000 | 16.78 | $649,900 | 30-Sep-2020 | 1994 | 05-Oct-2020 | 1,005 | $664 | Renovated/updated. |
| 6 4288 SARDIS STREET | $895,900 | $768,000 | 16.65 | $899,000 | 16-Sep-2020 | 2004 | 05-Oct-2020 | 1,447 | $619 | Renovated/updated. |
| 40 7488 MULBERRY PLACE | $910,000 | $822,000 | 10.71 | $898,800 | 01-Oct-2020 | 1998 | 05-Oct-2020 | 1,966 | $462 | Renovated/updated. |
| 41 5201 OAKMOUNT CRESCENT | $1,298,000 | $1,156,000 | 12.28 | $1,350,000 | 01-Apr-2020 | 1997 | 05-Oct-2020 | 2,536 | $511 | Renovated/updated. |
| 93 9088 HALSTON COURT | $1,095,000 | $1,084,000 | 1.01 | $1,098,000 | 29-Sep-2020 | 2007 | 06-Oct-2020 | 2,144 | $510 | Renovated/updated. |
| 30 7238 18TH AVENUE | $550,000 | $512,000 | 7.42 | $549,900 | 05-Oct-2020 | 1997 | 07-Oct-2020 | 870 | $632 | Renovated/updated. |
| 5 5188 SAVILE ROW | $760,000 | $751,000 | 1.20 | $864,000 | 05-Aug-2020 | 2018 | 09-Oct-2020 | 1,202 | $632 | Renovated/updated. |
| 8856 FINCH COURT | $755,000 | $724,800 | 4.17 | $778,800 | 26-Sep-2020 | 1987 | 09-Oct-2020 | 1,415 | $533 | Renovated/updated. |
| 88 6588 SOUTHOAKS CRESCENT | $370,000 | $348,000 | 6.32 | $418,800 | 21-Sep-2020 | 1997 | 09-Oct-2020 | 615 | $601 | Renovated/updated. |
| 208 3755 ALBERT STREET | $870,000 | $783,000 | 11.11 | $948,800 | 02-Jan-2020 | 1994 | 10-Oct-2020 | 1,244 | $699 | Renovated/updated. |
1 out of 12 unrenovated resale homes sold below assessed with a median sold price of 7.99
West Vancouver
| Address | Sold Price | Assessed | % Δ | True List Price | True List Date | Year Built | Sold Date | Sqft | Price per sqft | Notes |
|---|---|---|---|---|---|---|---|---|---|---|
| 38 2216 FOLKESTONE WAY | $1,191,000 | $1,033,000 | 15.30 | $1,474,000 | 18-Feb-2020 | 1975 | 30-Sep-2020 | 2,025 | $588 | Renovated/updated. |
0 out of 0 unrenovated resale homes sold below assessed with a median sold price of 0.00
New Westminster
| Address | Sold Price | Assessed | % Δ | True List Price | True List Date | Year Built | Sold Date | Sqft | Price per sqft | Notes |
|---|---|---|---|---|---|---|---|---|---|---|
| 102 365 GINGER DRIVE | $525,000 | $518,000 | 1.35 | $698,000 | 10-Jul-2018 | 1986 | 26-Sep-2020 | 1,224 | $428 | |
| 54 245 FRANCIS WAY | $912,500 | $882,000 | 3.46 | $945,000 | 22-Sep-2020 | 2007 | 27-Sep-2020 | 1,631 | $559 | |
| 14 232 TENTH STREET | $530,000 | $489,000 | 8.38 | $549,000 | 09-Mar-2020 | 1999 | 29-Sep-2020 | 870 | $609 | |
| 4 123 SEVENTH STREET | $525,000 | $505,000 | 3.96 | $499,900 | 15-Sep-2020 | 1999 | 30-Sep-2020 | 865 | $606 | Renovated/updated. |
| 17 1135 EWEN AVENUE | $543,000 | $504,000 | 7.74 | $549,000 | 08-Sep-2020 | 2012 | 09-Oct-2020 | 892 | $608 |
1 out of 5 unrenovated resale homes sold below assessed with a median sold price of 3.46
North Vancouver
| Address | Sold Price | Assessed | % Δ | True List Price | True List Date | Year Built | Sold Date | Sqft | Price per sqft | Notes |
|---|---|---|---|---|---|---|---|---|---|---|
| 19 2688 MOUNTAIN HIGHWAY | $999,000 | $1,005,000 | -0.60 | $1,199,000 | 08-Sep-2020 | 2003 | 24-Sep-2020 | 1,927 | $518 | |
| 327 E 15TH STREET | $1,105,000 | $1,111,000 | -0.54 | $1,099,000 | 08-Sep-2020 | 2008 | 25-Sep-2020 | 1,849 | $597 | |
| 509 4001 MT SEYMOUR PARKWAY | $1,259,000 | $933,100 | 34.93 | $1,279,900 | 08-Jul-2020 | 1972 | 25-Sep-2020 | 1,952 | $644 | Renovated/updated. |
| 303 3980 INLET CRESCENT | $1,038,000 | $1,064,000 | -2.44 | $1,098,800 | 02-Jun-2020 | 1990 | 26-Sep-2020 | 2,851 | $364 | |
| 5 251 W 14TH STREET | $910,000 | $793,100 | 14.74 | $939,000 | 21-Aug-2020 | 1980 | 27-Sep-2020 | 1,533 | $593 | Renovated/updated. |
| 1035 OLD LILLOOET ROAD | $839,000 | $735,900 | 14.01 | $849,000 | 23-Sep-2020 | 1973 | 27-Sep-2020 | 1,859 | $451 | Renovated/updated. |
| 33 433 SEYMOUR RIVER PLACE | $795,000 | $715,000 | 11.19 | $799,900 | 23-Sep-2020 | 2015 | 29-Sep-2020 | 1,004 | $791 | |
| 27 1925 INDIAN RIVER CRESCENT | $965,000 | $752,000 | 28.32 | ? | 24-May-2013 | 1988 | 30-Sep-2020 | 1,793 | $538 | Renovated/updated. |
| 4683 HOSKINS ROAD | $950,000 | $821,000 | 15.71 | $930,000 | 21-Sep-2020 | 1970 | 30-Sep-2020 | 1,651 | $575 | |
| 4 3022 SUNNYHURST ROAD | $1,150,000 | $1,079,000 | 6.58 | $1,250,000 | 27-Aug-2020 | 2016 | 01-Oct-2020 | 1,540 | $746 | |
| 53 433 SEYMOUR RIVER PLACE | $895,000 | $892,000 | 0.34 | $979,000 | 11-Aug-2020 | 2015 | 02-Oct-2020 | 1,430 | $625 | |
| 234 735 W 15TH STREET | $860,000 | $819,000 | 5.01 | $869,000 | 23-Sep-2020 | 2011 | 05-Oct-2020 | 991 | $867 | |
| 5 234 W 17TH STREET | $1,345,000 | $1,230,000 | 9.35 | $1,350,000 | 24-Sep-2020 | 1991 | 05-Oct-2020 | 1,865 | $721 | Renovated/updated. |
| 11 1818 CHESTERFIELD AVENUE | $979,000 | $925,000 | 5.84 | $979,000 | 01-Oct-2020 | 1994 | 05-Oct-2020 | 1,659 | $590 | |
| 6 433 SEYMOUR RIVER PLACE | $880,000 | $795,000 | 10.69 | $932,000 | 07-Sep-2020 | 2015 | 05-Oct-2020 | 1,087 | $809 | |
| 37 900 W 17TH STREET | $910,000 | $851,000 | 6.93 | $910,000 | 30-Sep-2020 | 1986 | 06-Oct-2020 | 1,404 | $648 | Renovated/updated. |
| 41 1001 NORTHLANDS DRIVE | $1,199,000 | $1,006,000 | 19.18 | $1,199,000 | 30-Sep-2020 | 1990 | 07-Oct-2020 | 1,758 | $682 | Renovated/updated. |
| 3168 MOUNTAIN HIGHWAY | $645,000 | $686,000 | -5.98 | $669,000 | 04-Aug-2020 | 1985 | 07-Oct-2020 | 1,073 | $601 | |
| 7 1075 LYNN VALLEY ROAD | $775,000 | $692,000 | 11.99 | $780,000 | 29-Sep-2020 | 2002 | 08-Oct-2020 | 1,010 | $767 | Renovated/updated. |
| 42 550 BROWNING PLACE | $985,000 | $843,000 | 16.84 | $979,000 | 09-Oct-2020 | 2006 | 09-Oct-2020 | 1,740 | $566 | Renovated/updated. |
| 11 230 W 15TH STREET | $999,999 | $949,000 | 5.37 | $1,025,000 | 10-Mar-2020 | 1981 | 10-Oct-2020 | 1,922 | $520 | Renovated/updated. |
| 4 225 W 14TH STREET | $952,000 | $810,300 | 17.49 | $925,000 | 08-Oct-2020 | 1979 | 10-Oct-2020 | 1,600 | $595 |
4 out of 12 unrenovated resale homes sold below assessed with a median sold price of 5.42
Delta
| Address | Sold Price | Assessed | % Δ | True List Price | True List Date | Year Built | Sold Date | Sqft | Price per sqft | Notes |
|---|---|---|---|---|---|---|---|---|---|---|
| 4916 ELLIS LANE | $697,500 | $636,000 | 9.67 | $718,800 | 01-Mar-2020 | 2019 | 24-Sep-2020 | 1,330 | $524 | |
| 8376 CENTRE STREET | $740,000 | $683,000 | 8.35 | $779,900 | 15-Sep-2020 | 1989 | 28-Sep-2020 | 1,882 | $393 | |
| 38 5510 ADMIRAL WAY | $933,000 | $896,000 | 4.13 | $939,000 | 03-Sep-2020 | 2016 | 01-Oct-2020 | 1,977 | $471 | |
| 70 10500 DELSOM CRESCENT | $910,000 | $842,000 | 8.08 | $928,880 | 23-Sep-2020 | 2014 | 01-Oct-2020 | 2,033 | $447 | |
| 23 10500 DELSOM CRESCENT | $937,000 | $897,000 | 4.46 | $968,000 | 24-Sep-2020 | 2014 | 03-Oct-2020 | 2,147 | $436 |
0 out of 4 unrenovated resale homes sold below assessed with a median sold price of 6.27
Surrey
| Address | Sold Price | Assessed | % Δ | True List Price | True List Date | Year Built | Sold Date | Sqft | Price per sqft | Notes |
|---|---|---|---|---|---|---|---|---|---|---|
| 8676 E TULSY CRESCENT | $457,000 | $402,900 | 13.43 | $524,999 | 29-Aug-2019 | 1978 | 24-Sep-2020 | 1,356 | $337 | Renovated/updated. |
| 3 13670 62 AVENUE | $624,000 | $608,000 | 2.63 | $644,900 | 16-Sep-2020 | 2016 | 24-Sep-2020 | 1,566 | $398 | |
| 20 16433 19 AVENUE | $639,999 | $681,000 | -6.02 | $699,999 | 28-Apr-2018 | 2019 | 24-Sep-2020 | 1,413 | $452 | |
| 29 16772 61 AVENUE | $538,000 | $514,000 | 4.67 | $539,500 | 23-Sep-2020 | 2005 | 25-Sep-2020 | 1,375 | $391 | |
| 25 8250 158 STREET | $830,000 | $845,000 | -1.78 | $859,000 | 25-Sep-2019 | 2005 | 25-Sep-2020 | 3,111 | $266 | |
| 225 2228 162 STREET | $544,250 | $497,000 | 9.51 | $550,000 | 21-Sep-2020 | 2013 | 25-Sep-2020 | 1,123 | $484 | |
| 85 5888 144 STREET | $568,000 | $537,000 | 5.77 | $550,000 | 21-Sep-2020 | 2014 | 25-Sep-2020 | 1,400 | $405 | |
| 36 16337 23A AVENUE | $819,800 | $757,000 | 8.30 | $849,800 | 29-Oct-2018 | 2016 | 25-Sep-2020 | 1,808 | $453 | |
| 2 2300 148 STREET | $852,500 | $746,000 | 14.28 | $869,000 | 08-Sep-2020 | 1994 | 25-Sep-2020 | 1,794 | $475 | |
| 16 5867 129 STREET | $756,000 | $742,000 | 1.89 | $787,900 | 15-Jun-2020 | 2017 | 25-Sep-2020 | 2,062 | $366 | Renovated/updated. |
| 48 15688 28 AVENUE | $790,000 | $682,000 | 15.84 | $799,000 | 11-Aug-2020 | 2015 | 25-Sep-2020 | 1,874 | $421 | |
| 57 2533 152 STREET | $740,000 | $863,000 | -14.25 | $799,000 | 27-Jul-2020 | 1991 | 26-Sep-2020 | 3,120 | $237 | |
| 8 5945 177B STREET | $650,000 | $606,000 | 7.26 | $658,900 | 22-Jun-2020 | 2019 | 26-Sep-2020 | 1,650 | $393 | |
| 74 15828 27 AVENUE | $595,000 | $531,000 | 12.05 | $628,000 | 06-Sep-2020 | 2018 | 26-Sep-2020 | 1,198 | $496 | Renovated/updated. |
| 56 15665 MOUNTAIN VIEW DRIVE | $781,500 | $632,400 | 23.58 | $789,000 | 10-Mar-2020 | 2019 | 26-Sep-2020 | 1,960 | $398 | Brand New. |
| 2 12945 17 AVENUE | $980,000 | $842,000 | 16.39 | $1,149,000 | 01-May-2018 | 1986 | 26-Sep-2020 | 2,175 | $450 | Renovated/updated. |
| 40 2979 156 STREET | $545,000 | $492,000 | 10.77 | $559,000 | 03-Sep-2020 | 2009 | 26-Sep-2020 | 1,227 | $444 | |
| 44 6140 192 STREET | $502,000 | $567,000 | -11.46 | $499,900 | 31-Aug-2020 | 1988 | 26-Sep-2020 | 1,583 | $317 | |
| 78 16233 83 AVENUE | $559,000 | $528,000 | 5.87 | $549,800 | 18-Sep-2020 | 2006 | 26-Sep-2020 | 1,248 | $447 | |
| 30 15885 26 AVENUE | $880,000 | $868,000 | 1.38 | $889,900 | 17-Jul-2020 | 2008 | 27-Sep-2020 | 3,052 | $288 | |
| 156 15236 36 AVENUE | $555,000 | $551,000 | 0.73 | $559,900 | 22-Sep-2020 | 2003 | 27-Sep-2020 | 1,505 | $368 | |
| 39 3009 156 STREET | $629,900 | $582,000 | 8.23 | $619,900 | 22-Sep-2020 | 2010 | 27-Sep-2020 | 1,475 | $427 | Renovated/updated. |
| 27 14838 61 AVENUE | $587,000 | $561,000 | 4.63 | $589,000 | 08-Sep-2020 | 2011 | 27-Sep-2020 | 1,364 | $430 | |
| 2 14231 18A AVENUE | $595,000 | $569,900 | 4.40 | $599,000 | 17-Sep-2020 | 1983 | 27-Sep-2020 | 1,046 | $568 | Renovated/updated. |
| 8 8250 158 STREET | $743,000 | $779,000 | -4.62 | $749,000 | 07-Sep-2020 | 2005 | 28-Sep-2020 | 2,438 | $304 | |
| 128 6109 W BOUNDARY DRIVE | $702,000 | $605,000 | 16.03 | $714,900 | 23-Sep-2020 | 1988 | 28-Sep-2020 | 1,867 | $376 | |
| 42 15588 32 AVENUE | $641,100 | $656,000 | -2.27 | $648,000 | 16-Sep-2020 | 2013 | 28-Sep-2020 | 1,527 | $419 | |
| 24 14909 32 AVENUE | $788,000 | $788,000 | 0.00 | $875,000 | 11-Aug-2020 | 1995 | 28-Sep-2020 | 1,486 | $530 | |
| 51 2729 158 STREET | $628,000 | $545,000 | 15.23 | $638,000 | 21-Sep-2020 | 2008 | 28-Sep-2020 | 1,377 | $456 | Renovated/updated. |
| 86 8888 151 STREET | $645,000 | $642,000 | 0.47 | $649,800 | 24-Sep-2020 | 2000 | 28-Sep-2020 | 1,517 | $425 | |
| 122 15500 ROSEMARY HEIGHTS CRESCENT | $955,000 | $854,000 | 11.83 | $959,900 | 02-Sep-2020 | 2000 | 28-Sep-2020 | 2,085 | $458 | |
| 74 8130 136A STREET | $627,500 | $593,000 | 5.82 | $638,000 | 21-Sep-2020 | 2016 | 28-Sep-2020 | 1,523 | $412 | Renovated/updated. |
| 22 6110 138 STREET | $655,000 | $613,000 | 6.85 | $650,000 | 23-Sep-2020 | 2005 | 28-Sep-2020 | 2,044 | $320 | |
| 35 14888 62 AVENUE | $610,000 | $582,000 | 4.81 | $639,999 | 23-Sep-2020 | 2013 | 28-Sep-2020 | 1,507 | $404 | |
| 1875 LILAC DRIVE | $550,000 | $518,600 | 6.05 | $550,000 | 24-Sep-2020 | 1979 | 28-Sep-2020 | 1,804 | $304 | |
| 123 19525 73 AVENUE | $729,000 | $692,000 | 5.35 | $729,000 | 23-Sep-2020 | 2011 | 28-Sep-2020 | 2,013 | $362 | |
| 2 13964 72 AVENUE | $571,000 | $560,000 | 1.96 | $599,900 | 24-Aug-2020 | 1988 | 28-Sep-2020 | 2,025 | $281 | |
| 49 7156 144 STREET | $585,000 | $567,000 | 3.17 | $615,000 | 03-Aug-2020 | 2009 | 29-Sep-2020 | 1,458 | $401 | |
| 12 6785 193 STREET | $643,000 | $633,000 | 1.58 | $653,900 | 27-Jul-2020 | 2006 | 29-Sep-2020 | 1,961 | $327 | |
| 163 13888 70 AVENUE | $525,000 | $560,000 | -6.25 | $529,900 | 24-Sep-2020 | 1994 | 29-Sep-2020 | 1,557 | $337 | |
| 7 18819 71 AVENUE | $639,900 | $665,000 | -3.77 | $639,900 | 10-Sep-2020 | 2013 | 29-Sep-2020 | 1,626 | $393 | |
| 51 2929 156 STREET | $583,000 | $520,000 | 12.12 | $589,000 | 23-Sep-2020 | 2011 | 29-Sep-2020 | 1,357 | $429 | |
| 27 6383 140 STREET | $617,000 | $584,000 | 5.65 | $619,000 | 14-Sep-2020 | 2011 | 29-Sep-2020 | 1,696 | $363 | |
| 37 13528 96 AVENUE | $590,000 | $573,000 | 2.97 | $699,888 | 04-Dec-2017 | 2006 | 29-Sep-2020 | 1,390 | $424 | |
| 70 9374 122 STREET | $494,013 | $548,400 | -9.92 | $499,013 | 16-Sep-2020 | 1974 | 29-Sep-2020 | 1,516 | $325 | |
| 19 15068 58 AVENUE | $525,000 | $442,000 | 18.78 | $538,888 | 18-Aug-2020 | 2000 | 29-Sep-2020 | 1,168 | $449 | |
| 3 15273 24 AVENUE | $640,000 | $658,000 | -2.74 | $649,900 | 01-Sep-2020 | 1991 | 30-Sep-2020 | 1,670 | $383 | Renovated/updated. |
| 9765 148A STREET | $580,000 | $466,000 | 24.46 | $589,900 | 24-Sep-2020 | 1986 | 30-Sep-2020 | 1,536 | $377 | |
| 37 18088 8 AVENUE | $1,075,000 | $1,002,000 | 7.29 | $1,199,890 | 28-Feb-2019 | 2001 | 30-Sep-2020 | 3,460 | $310 | Renovated/updated. |
| 28 16458 23A AVENUE | $655,000 | $687,000 | -4.66 | $649,900 | 24-Sep-2020 | 2014 | 30-Sep-2020 | 1,661 | $394 | Renovated/updated. |
| 30 9533 130A STREET | $667,000 | $641,000 | 4.06 | $689,000 | 04-Sep-2020 | 2011 | 30-Sep-2020 | 1,762 | $378 | |
| 80 12677 63 AVENUE | $580,000 | $589,000 | -1.53 | $599,800 | 06-Aug-2020 | 2005 | 30-Sep-2020 | 1,654 | $350 | Renovated/updated. |
| 36 2729 158 STREET STREET | $557,500 | $511,000 | 9.10 | $569,900 | 31-Aug-2020 | 2009 | 01-Oct-2020 | 1,399 | $398 | Renovated/updated. |
| 53 14555 68 AVENUE | $560,000 | $506,000 | 10.67 | $548,000 | 04-Sep-2020 | 2016 | 01-Oct-2020 | 1,193 | $469 | |
| 22 16128 86 AVENUE | $655,000 | $642,000 | 2.02 | $659,000 | 08-Sep-2020 | 1993 | 01-Oct-2020 | 1,798 | $364 | Renovated/updated. |
| 60 5858 142 STREET | $571,000 | $538,000 | 6.13 | $564,900 | 27-Sep-2020 | 2014 | 01-Oct-2020 | 1,375 | $415 | |
| 49 3109 161 STREET | $1,048,000 | $1,064,000 | -1.50 | ? | 20-Jul-2012 | 2009 | 01-Oct-2020 | 3,315 | $316 | |
| 34 16995 64 AVENUE | $765,000 | $712,000 | 7.44 | $879,900 | 04-Dec-2019 | 2003 | 02-Oct-2020 | 2,891 | $264 | |
| 62 15353 100 AVENUE | $505,000 | $468,000 | 7.91 | $510,000 | 22-Sep-2020 | 2005 | 02-Oct-2020 | 1,076 | $469 | Renovated/updated. |
| 52 15152 62A AVENUE | $567,000 | $532,000 | 6.58 | $579,900 | 23-Sep-2020 | 2005 | 02-Oct-2020 | 1,432 | $395 | |
| 20 2533 152 STREET | $735,000 | $780,000 | -5.77 | $811,000 | 08-Jul-2020 | 1991 | 02-Oct-2020 | 1,550 | $474 | Renovated/updated. |
| 2 7955 122 STREET | $579,000 | $589,000 | -1.70 | $588,000 | 28-Aug-2020 | 1989 | 02-Oct-2020 | 2,015 | $287 | |
| 5 14968 24 AVENUE | $950,000 | $1,012,000 | -6.13 | $996,800 | 15-Oct-2018 | 2001 | 02-Oct-2020 | 2,175 | $436 | Renovated/updated. |
| 37 8130 136A STREET | $620,000 | $590,000 | 5.08 | $650,000 | 16-Sep-2020 | 2016 | 02-Oct-2020 | 1,525 | $406 | |
| 11 15237 36 AVENUE | $718,000 | $677,000 | 6.06 | $749,000 | 26-Aug-2020 | 2006 | 03-Oct-2020 | 1,823 | $393 | Renovated/updated. |
| 132 15153 98 AVENUE | $370,000 | $367,000 | 0.82 | $395,000 | 23-Jun-2020 | 1986 | 03-Oct-2020 | 1,381 | $267 | Renovated/updated. |
| 76 7233 189 STREET | $515,000 | $425,000 | 21.18 | $534,888 | 10-Sep-2020 | 2009 | 03-Oct-2020 | 1,163 | $442 | |
| 130 12711 64 AVENUE | $519,500 | $478,000 | 8.68 | $524,500 | 29-Sep-2020 | 2005 | 03-Oct-2020 | 1,330 | $390 | |
| 33 14959 58 AVENUE | $565,000 | $501,000 | 12.77 | $574,900 | 25-Sep-2020 | 2002 | 03-Oct-2020 | 1,485 | $380 | |
| 26 16588 FRASER HIGHWAY | $574,000 | $496,000 | 15.73 | $599,000 | 02-Jul-2020 | 2006 | 03-Oct-2020 | 1,524 | $376 | |
| 127 2280 163 STREET | $819,900 | $788,000 | 4.05 | $876,000 | 22-Oct-2019 | 2016 | 03-Oct-2020 | 1,932 | $424 | Renovated/updated. |
| 107 10289 133 STREET | $550,000 | $574,000 | -4.18 | $595,000 | 21-Aug-2020 | 2008 | 03-Oct-2020 | 1,554 | $353 | |
| 9 15075 60 AVENUE | $548,000 | $495,000 | 10.71 | $554,900 | 21-Sep-2020 | 2005 | 04-Oct-2020 | 1,311 | $418 | Renovated/updated. |
| 153 6671 121 STREET | $541,000 | $511,000 | 5.87 | $536,000 | 25-Sep-2020 | 2009 | 04-Oct-2020 | 1,246 | $434 | |
| 105 6109 W BOUNDARY DRIVE | $725,000 | $690,000 | 5.07 | $759,900 | 01-Sep-2020 | 1988 | 04-Oct-2020 | 2,223 | $326 | Renovated/updated. |
| 30 8676 158 STREET | $600,000 | $586,000 | 2.39 | $629,000 | 07-Jul-2020 | 2008 | 04-Oct-2020 | 1,586 | $378 | |
| 15 3103 160 STREET | $1,100,000 | $994,000 | 10.66 | $1,268,000 | 26-Oct-2018 | 2016 | 04-Oct-2020 | 3,297 | $333 | Renovated/updated. |
| 4 2955 156 STREET | $633,500 | $607,000 | 4.37 | $648,000 | 01-Oct-2020 | 2010 | 05-Oct-2020 | 1,383 | $458 | |
| 43 11255 132 STREET | $550,000 | $581,000 | -5.34 | $615,000 | 22-May-2019 | 2008 | 05-Oct-2020 | 1,448 | $379 | |
| 16 14959 58 AVENUE | $661,000 | $622,000 | 6.27 | $672,800 | 24-Sep-2020 | 2002 | 05-Oct-2020 | 1,933 | $341 | Renovated/updated. |
| 21 8338 158 STREET | $528,500 | $410,000 | 28.90 | $499,900 | 28-Sep-2020 | 1996 | 05-Oct-2020 | 1,433 | $368 | |
| 125 7156 121 STREET | $435,000 | $431,000 | 0.93 | $425,000 | 01-Oct-2020 | 1987 | 05-Oct-2020 | 1,615 | $269 | |
| 50 16388 85 AVENUE | $592,000 | $595,000 | -0.50 | $599,000 | 21-Sep-2020 | 2001 | 05-Oct-2020 | 1,715 | $345 | Renovated/updated. |
| 161 15168 36 AVENUE | $580,000 | $592,000 | -2.03 | $589,900 | 10-Sep-2020 | 2005 | 05-Oct-2020 | 1,665 | $348 | |
| 11 12128 68 AVENUE | $582,500 | $570,000 | 2.19 | $629,800 | 13-Jul-2020 | 1999 | 05-Oct-2020 | 1,438 | $405 | Renovated/updated. |
| 118 5858 142 STREET | $570,000 | $551,000 | 3.45 | $559,800 | 05-Oct-2020 | 2014 | 05-Oct-2020 | 1,312 | $434 | |
| 42 19478 65 AVENUE | $535,000 | $506,000 | 5.73 | $555,000 | 19-Aug-2020 | 2009 | 05-Oct-2020 | 1,264 | $423 | |
| 32 8418 163 STREET | $580,000 | $561,000 | 3.39 | $600,000 | 25-Sep-2017 | 2010 | 05-Oct-2020 | 1,412 | $410 | |
| 8 2958 159 STREET | $682,900 | $678,000 | 0.72 | $679,900 | 30-Sep-2020 | 2016 | 06-Oct-2020 | 1,475 | $462 | |
| 139 14154 103 AVENUE | $569,000 | $561,000 | 1.43 | $574,900 | 31-Aug-2020 | 1988 | 06-Oct-2020 | 1,571 | $362 | |
| 2 12067 93A AVENUE | $534,500 | $508,700 | 5.07 | $609,000 | 17-Feb-2020 | 1974 | 06-Oct-2020 | 1,460 | $366 | Renovated/updated. |
| 50 7088 191 STREET | $610,000 | $592,000 | 3.04 | $628,888 | 10-Aug-2020 | 2007 | 06-Oct-2020 | 1,575 | $387 | |
| 64 19097 64 AVENUE | $585,500 | $530,000 | 10.47 | $339,900 | 30-Jun-2015 | 2015 | 06-Oct-2020 | 1,401 | $417 | |
| 183 2501 161A STREET | $552,000 | $471,000 | 17.20 | $499,000 | 30-Sep-2020 | 2010 | 06-Oct-2020 | 1,250 | $441 | |
| 26 7090 180 STREET | $697,000 | $675,000 | 3.26 | $749,900 | 12-Aug-2020 | 2012 | 06-Oct-2020 | 1,936 | $360 | |
| 6 2603 162 STREET | $1,243,000 | $1,118,000 | 11.18 | $1,299,900 | 29-Jul-2020 | 2008 | 07-Oct-2020 | 3,785 | $328 | |
| 7 12070 76 AVENUE | $587,000 | $590,000 | -0.51 | $599,000 | 30-Jul-2020 | 2004 | 07-Oct-2020 | 2,177 | $269 | |
| 6022 E GREENSIDE DRIVE | $440,000 | $408,900 | 7.61 | $469,900 | 09-Sep-2020 | 1978 | 07-Oct-2020 | 940 | $468 | Renovated/updated. |
| 39 15188 62A AVENUE | $765,000 | $744,000 | 2.82 | $774,900 | 01-Oct-2020 | 2005 | 09-Oct-2020 | 1,773 | $431 | |
| 201 13898 64 AVENUE | $645,000 | $602,000 | 7.14 | $589,999 | 15-Sep-2020 | 2018 | 09-Oct-2020 | 1,600 | $403 | Renovated/updated. |
| 3 15860 82 AVENUE | $749,000 | $708,000 | 5.79 | $749,900 | 09-Oct-2020 | 1993 | 09-Oct-2020 | 2,163 | $346 | Renovated/updated. |
| 36 18883 65 AVENUE | $616,000 | $555,000 | 10.99 | $624,900 | 09-Sep-2020 | 1997 | 09-Oct-2020 | 1,555 | $396 | Renovated/updated. |
| 19230 FAIRWAY DRIVE | $465,000 | $428,100 | 8.62 | $474,900 | 28-Sep-2020 | 1978 | 13-Oct-2020 | 1,083 | $429 | Renovated/updated. |
| 34 1725 SOUTHMERE CRESCENT | $865,000 | $807,000 | 7.19 | $889,000 | 13-Aug-2020 | 1981 | 14-Oct-2020 | 2,175 | $397 | Renovated/updated. |
14 out of 67 unrenovated resale homes sold below assessed with a median sold price of 4.63
Port Moody
| Address | Sold Price | Assessed | % Δ | True List Price | True List Date | Year Built | Sold Date | Sqft | Price per sqft | Notes |
|---|---|---|---|---|---|---|---|---|---|---|
| 45 100 KLAHANIE DRIVE | $1,045,000 | $1,010,000 | 3.47 | $1,130,000 | 06-Jul-2020 | 2005 | 25-Sep-2020 | 1,589 | $657 | Renovated/updated. |
| 482 CARLSEN PLACE | $620,000 | $585,000 | 5.98 | $624,900 | 15-Sep-2020 | 1979 | 25-Sep-2020 | 1,539 | $402 | |
| 306 3105 ST.GEORGE STREET | $1,029,900 | $885,000 | 16.37 | $1,029,900 | 22-Sep-2020 | 2019 | 25-Sep-2020 | 1,550 | $664 | |
| 302 3105 ST GEORGE STREET | $1,029,900 | $885,000 | 16.37 | $1,029,900 | 14-Jan-2020 | 2019 | 26-Sep-2020 | 1,550 | $664 | |
| 86 2200 PANORAMA DRIVE | $719,600 | $680,000 | 5.82 | $726,800 | 23-Sep-2020 | 2005 | 27-Sep-2020 | 1,413 | $509 | |
| 17 2000 PANORAMA DRIVE | $685,000 | $676,000 | 1.33 | $758,888 | 12-Dec-2018 | 2003 | 27-Sep-2020 | 1,417 | $483 | Renovated/updated. |
| 18 1560 PRINCE STREET | $884,000 | $819,000 | 7.94 | $888,000 | 14-Sep-2020 | 1992 | 27-Sep-2020 | 2,267 | $389 | |
| 39 181 RAVINE DRIVE | $938,000 | $919,000 | 2.07 | $950,000 | 23-Sep-2020 | 1990 | 28-Sep-2020 | 2,523 | $371 | |
| 36 2200 PANORAMA DRIVE | $870,000 | $753,000 | 15.54 | $839,000 | 27-Sep-2020 | 2005 | 01-Oct-2020 | 1,562 | $556 | Renovated/updated. |
| 150 101 PARKSIDE DRIVE | $1,388,000 | $1,264,000 | 9.81 | $1,399,000 | 08-Sep-2020 | 1991 | 01-Oct-2020 | 3,492 | $397 | Renovated/updated. |
| 111 3333 DEWDNEY TRUNK ROAD | $780,000 | $761,000 | 2.50 | $810,000 | 09-Sep-2020 | 2011 | 03-Oct-2020 | 1,276 | $611 | |
| 148 101 PARKSIDE DRIVE | $1,151,000 | $1,066,000 | 7.97 | $1,179,000 | 18-Sep-2020 | 1991 | 03-Oct-2020 | 2,857 | $402 | Renovated/updated. |
| 9 15 FOREST PARK WAY | $623,000 | $529,000 | 17.77 | $624,800 | 30-Sep-2020 | 2000 | 05-Oct-2020 | 1,120 | $556 | Renovated/updated. |
| 29 100 KLAHANIE DRIVE | $945,000 | $996,000 | -5.12 | ? | 08-May-2013 | 2005 | 06-Oct-2020 | 1,820 | $519 | Renovated/updated. |
| 72 2200 PANORAMA DRIVE | $801,000 | $749,000 | 6.94 | $778,000 | 01-Oct-2020 | 2005 | 06-Oct-2020 | 1,508 | $531 | |
| 109 3333 DEWDNEY TRUNK ROAD | $799,000 | $763,000 | 4.72 | $799,000 | 06-Oct-2020 | 2011 | 11-Oct-2020 | 1,492 | $535 | Renovated/updated. |
0 out of 6 unrenovated resale homes sold below assessed with a median sold price of 5.90
Coquitlam
| Address | Sold Price | Assessed | % Δ | True List Price | True List Date | Year Built | Sold Date | Sqft | Price per sqft | Notes |
|---|---|---|---|---|---|---|---|---|---|---|
| 104 658 HARRISON AVENUE | $950,000 | $861,000 | 10.34 | $998,888 | 19-Mar-2018 | 2015 | 24-Sep-2020 | 1,812 | $524 | |
| 218 618 LANGSIDE AVENUE | $620,000 | $513,000 | 20.86 | $638,800 | 27-Jul-2020 | 2013 | 24-Sep-2020 | 916 | $676 | |
| 182 3105 DAYANEE SPRINGS BOULEVARD | $1,035,000 | $891,000 | 16.16 | $1,135,000 | 27-Nov-2018 | 2009 | 25-Sep-2020 | 2,498 | $414 | |
| 14 1219 BURKE MOUNTAIN STREET | $774,000 | $733,000 | 5.59 | $775,000 | 21-Sep-2020 | 2013 | 25-Sep-2020 | 1,647 | $469 | |
| 109 3010 RIVERBEND DRIVE | $600,000 | $560,000 | 7.14 | $619,000 | 20-Jul-2020 | 2011 | 25-Sep-2020 | 1,235 | $485 | |
| 92 1125 KENSAL PLACE | $840,000 | $728,000 | 15.38 | $859,800 | 15-Sep-2020 | 2010 | 25-Sep-2020 | 1,411 | $595 | |
| 17 1295 SOBALL STREET | $748,500 | $700,000 | 6.93 | $780,000 | 07-Feb-2018 | 2011 | 26-Sep-2020 | 1,385 | $540 | |
| 1 1299 COAST MERIDIAN ROAD | $818,000 | $838,000 | -2.39 | $899,000 | 02-Oct-2019 | 2012 | 26-Sep-2020 | 1,948 | $419 | Renovated/updated. |
| 116 2998 ROBSON DRIVE | $915,000 | $829,000 | 10.37 | $995,000 | 28-Aug-2020 | 1993 | 27-Sep-2020 | 3,081 | $296 | Renovated/updated. |
| 60 1305 SOBALL STREET | $752,000 | $736,000 | 2.17 | ? | 24-Apr-2011 | 2011 | 27-Sep-2020 | 1,417 | $530 | |
| 27 1190 FALCON DRIVE | $760,000 | $649,000 | 17.10 | $820,000 | 07-Aug-2019 | 1988 | 28-Sep-2020 | 2,012 | $377 | Renovated/updated. |
| 1 3380 FRANCIS CRESCENT | $872,000 | $793,000 | 9.96 | $889,900 | 11-Jun-2020 | 2012 | 28-Sep-2020 | 1,830 | $476 | |
| 303 1180 FALCON DRIVE | $845,000 | $854,000 | -1.05 | $978,800 | 10-Sep-2018 | 1987 | 29-Sep-2020 | 2,275 | $371 | Renovated/updated. |
| 75 1561 BOOTH AVENUE | $499,900 | $446,000 | 12.09 | $509,990 | 15-Sep-2020 | 1997 | 29-Sep-2020 | 919 | $543 | Renovated/updated. |
| 51 1140 FALCON DRIVE | $725,000 | $634,200 | 14.32 | $745,000 | 23-Sep-2020 | 1986 | 29-Sep-2020 | 1,665 | $435 | Renovated/updated. |
| 26 3461 PRINCETON AVENUE | $979,510 | $958,000 | 2.25 | ? | 16-Jun-2014 | 2014 | 30-Sep-2020 | 2,278 | $429 | |
| 27 2978 WALTON AVENUE | $465,000 | $476,500 | -2.41 | $479,000 | 11-Aug-2020 | 1988 | 30-Sep-2020 | 963 | $482 | Renovated/updated. |
| 35 1561 BOOTH AVENUE | $493,000 | $499,000 | -1.20 | $498,500 | 28-Sep-2020 | 1997 | 03-Oct-2020 | 1,060 | $465 | Renovated/updated. |
| 12 1383 BRUNETTE AVENUE | $565,000 | $570,000 | -0.88 | $575,000 | 31-Aug-2020 | 1994 | 04-Oct-2020 | 1,356 | $416 | |
| 19 1328 BRUNETTE AVENUE | $610,000 | $566,300 | 7.72 | $599,900 | 23-Sep-2020 | 1988 | 05-Oct-2020 | 1,442 | $423 | Renovated/updated. |
| 410 1485 PARKWAY BOULEVARD | $880,000 | $739,000 | 19.08 | $865,000 | 28-Sep-2020 | 1995 | 05-Oct-2020 | 1,921 | $458 | |
| 34 3470 HIGHLAND DRIVE | $770,000 | $713,000 | 7.99 | $785,000 | 28-Sep-2020 | 2014 | 05-Oct-2020 | 1,403 | $548 | |
| 19 2978 WALTON AVENUE | $445,000 | $484,300 | -8.11 | $469,000 | 13-Jan-2020 | 1988 | 06-Oct-2020 | 959 | $464 | |
| 50 2978 WHISPER WAY | $960,000 | $927,000 | 3.56 | $1,029,000 | 25-Jun-2020 | 2004 | 07-Oct-2020 | 2,293 | $418 | |
| 51 2978 WHISPER WAY | $965,000 | $927,000 | 4.10 | $1,018,800 | 07-Jul-2020 | 2004 | 07-Oct-2020 | 2,298 | $419 | |
| 59 3010 RIVERBEND DRIVE | $620,000 | $569,000 | 8.96 | $629,000 | 06-Oct-2020 | 2011 | 08-Oct-2020 | 1,200 | $516 | Renovated/updated. |
| 2 3431 GALLOWAY AVENUE | $780,000 | $703,000 | 10.95 | $799,900 | 21-Sep-2020 | 2012 | 08-Oct-2020 | 1,505 | $518 | |
| 82 688 EDGAR AVENUE | $735,000 | $628,000 | 17.04 | $729,900 | 07-Oct-2020 | 2008 | 09-Oct-2020 | 1,298 | $566 | Renovated/updated. |
| 137 1460 SOUTHVIEW STREET | $855,000 | $809,000 | 5.69 | $838,000 | 01-Oct-2020 | 2011 | 10-Oct-2020 | 1,837 | $465 | |
| 60 1228 HUDSON STREET | $1,070,000 | $1,037,000 | 3.18 | $1,019,900 | 02-Oct-2020 | 2019 | 10-Oct-2020 | 1,690 | $633 | Renovated/updated. Brand New. |
| 29 1305 SOBALL STREET | $737,000 | $732,000 | 0.68 | $749,000 | 08-Oct-2020 | 2010 | 10-Oct-2020 | 1,364 | $540 | |
| 129 2998 ROBSON DRIVE | $855,000 | $791,000 | 8.09 | $869,000 | 06-Oct-2020 | 1993 | 11-Oct-2020 | 2,185 | $391 | Renovated/updated. |
| 28 2978 WHISPER WAY | $888,000 | $832,000 | 6.73 | $799,900 | 05-Oct-2020 | 2004 | 12-Oct-2020 | 2,034 | $436 |
2 out of 20 unrenovated resale homes sold below assessed with a median sold price of 6.83
Port Coquitlam
| Address | Sold Price | Assessed | % Δ | True List Price | True List Date | Year Built | Sold Date | Sqft | Price per sqft | Notes |
|---|---|---|---|---|---|---|---|---|---|---|
| 29 788 CITADEL DRIVE | $930,000 | $824,000 | 12.86 | $939,000 | 08-Sep-2020 | 1993 | 24-Sep-2020 | 3,177 | $292 | Renovated/updated. |
| 45 2423 AVON PLACE | $532,450 | $483,000 | 10.24 | $539,900 | 25-Sep-2020 | 2012 | 27-Sep-2020 | 903 | $589 | Renovated/updated. |
| 56 2358 RANGER LANE | $695,000 | $670,000 | 3.73 | $709,000 | 01-Jul-2020 | 2015 | 27-Sep-2020 | 1,300 | $534 | |
| 1120 O’FLAHERTY GATE | $490,000 | $457,600 | 7.08 | $528,000 | 29-Jul-2020 | 1993 | 27-Sep-2020 | 1,034 | $473 | |
| 25 1336 PITT RIVER ROAD | $638,000 | $541,000 | 17.93 | $669,000 | 24-Aug-2020 | 1989 | 28-Sep-2020 | 1,660 | $384 | Renovated/updated. |
| 80 758 RIVERSIDE DRIVE | $775,000 | $694,000 | 11.67 | $750,000 | 21-Sep-2020 | 1997 | 28-Sep-2020 | 1,844 | $420 | |
| 9 1015 FRASERVIEW STREET | $785,000 | $734,000 | 6.95 | $784,000 | 23-Sep-2020 | 1988 | 28-Sep-2020 | 2,453 | $320 | Renovated/updated. |
| 38 1207 CONFEDERATION DRIVE | $712,000 | $672,000 | 5.95 | $448,888 | 18-Mar-2014 | 1991 | 29-Sep-2020 | 1,485 | $479 | |
| 11 758 RIVERSIDE DRIVE | $729,000 | $644,000 | 13.20 | $729,000 | 30-Sep-2020 | 1995 | 01-Oct-2020 | 1,597 | $456 | Renovated/updated. |
| 22 2450 LOBB AVENUE | $668,000 | $640,000 | 4.38 | $649,900 | 21-Sep-2020 | 1993 | 01-Oct-2020 | 1,503 | $444 | Renovated/updated. |
| 93 2418 AVON PLACE | $665,000 | $631,000 | 5.39 | $644,900 | 28-Sep-2020 | 2009 | 02-Oct-2020 | 1,350 | $492 | |
| 1137 BENNET DRIVE | $735,000 | $612,000 | 20.10 | $749,000 | 10-Sep-2020 | 1997 | 02-Oct-2020 | 1,814 | $405 | |
| 23 2422 HAWTHORNE AVENUE | $521,900 | $506,000 | 3.14 | $539,000 | 04-Sep-2020 | 1996 | 05-Oct-2020 | 1,197 | $436 | Renovated/updated. |
| 35 1238 EASTERN DRIVE | $753,000 | $683,000 | 10.25 | $785,000 | 22-Jul-2020 | 1992 | 05-Oct-2020 | 1,868 | $403 |
0 out of 7 unrenovated resale homes sold below assessed with a median sold price of 7.08
Pitt Meadows
| Address | Sold Price | Assessed | % Δ | True List Price | True List Date | Year Built | Sold Date | Sqft | Price per sqft | Notes |
|---|---|---|---|---|---|---|---|---|---|---|
| 70 19572 FRASER WAY | $585,000 | $572,000 | 2.27 | $609,900 | 20-Mar-2019 | 2007 | 28-Sep-2020 | 1,496 | $391 |
0 out of 1 unrenovated resale homes sold below assessed with a median sold price of 2.27
Langley
| Address | Sold Price | Assessed | % Δ | True List Price | True List Date | Year Built | Sold Date | Sqft | Price per sqft | Notes |
|---|---|---|---|---|---|---|---|---|---|---|
| 6 20857 77A AVENUE | $725,000 | $614,000 | 18.08 | $719,000 | 23-Sep-2020 | 2017 | 24-Sep-2020 | 1,700 | $426 | |
| 105 19649 53 AVENUE | $650,000 | $537,000 | 21.04 | $695,000 | 15-Jul-2020 | 1990 | 24-Sep-2020 | 1,292 | $503 | Renovated/updated. |
| 41 20451 84 AVENUE | $670,000 | $599,000 | 11.85 | $688,000 | 14-Sep-2020 | 2018 | 25-Sep-2020 | 1,559 | $429 | |
| 39 7169 208A STREET | $682,500 | $574,000 | 18.90 | $709,900 | 15-Jul-2020 | 2018 | 25-Sep-2020 | 1,671 | $408 | Renovated/updated. |
| 40 8890 WALNUT GROVE DRIVE | $523,000 | $515,000 | 1.55 | $529,000 | 24-Sep-2020 | 1995 | 26-Sep-2020 | 1,592 | $328 | |
| 22 20852 77A AVENUE | $670,000 | $616,000 | 8.77 | $679,000 | 22-Sep-2020 | 2015 | 26-Sep-2020 | 1,724 | $388 | |
| 40 7686 209 STREET | $700,000 | $681,000 | 2.79 | $700,000 | 11-Aug-2020 | 2015 | 27-Sep-2020 | 1,870 | $374 | |
| 3 20761 DUNCAN WAY | $529,000 | $511,000 | 3.52 | $529,900 | 10-Sep-2020 | 2004 | 28-Sep-2020 | 1,340 | $394 | |
| 32 7059 210 STREET | $840,000 | $728,000 | 15.38 | $875,000 | 23-Jun-2020 | 2015 | 28-Sep-2020 | 2,352 | $357 | |
| 2 21150 76A AVENUE | $723,880 | $640,000 | 13.11 | $748,888 | 13-Sep-2018 | 2017 | 29-Sep-2020 | 1,673 | $432 | Renovated/updated. |
| 16 19938 70 AVENUE | $800,000 | $790,000 | 1.27 | $839,900 | 02-Sep-2020 | 2017 | 29-Sep-2020 | 2,558 | $312 | |
| 77 8476 207A STREET | $580,000 | $503,000 | 15.31 | $599,000 | 14-Jul-2020 | 2016 | 29-Sep-2020 | 1,314 | $441 | |
| 44 20751 87 AVENUE | $725,000 | $659,000 | 10.02 | $698,800 | 25-Sep-2020 | 1995 | 29-Sep-2020 | 1,508 | $480 | |
| 75 20350 68 AVENUE | $615,000 | $583,000 | 5.49 | $630,000 | 08-Sep-2020 | 2005 | 30-Sep-2020 | 1,676 | $366 | Renovated/updated. |
| 68 19649 53 AVENUE | $635,000 | $607,000 | 4.61 | $670,000 | 22-Jun-2020 | 1990 | 30-Sep-2020 | 1,464 | $433 | Renovated/updated. |
| 4 9045 WALNUT GROVE DRIVE | $560,000 | $497,000 | 12.68 | $549,000 | 24-Sep-2020 | 1989 | 30-Sep-2020 | 1,474 | $379 | Renovated/updated. |
| 26 9036 208 STREET | $495,000 | $457,000 | 8.32 | $499,900 | 24-Sep-2020 | 1995 | 30-Sep-2020 | 1,401 | $353 | Renovated/updated. |
| 2 21746 52 AVENUE | $705,000 | $816,000 | -13.60 | $821,800 | 16-Sep-2019 | 1993 | 01-Oct-2020 | 1,744 | $404 | |
| 23 20966 77A AVENUE | $605,000 | $562,000 | 7.65 | $609,900 | 29-Sep-2020 | 2012 | 01-Oct-2020 | 1,447 | $418 | Renovated/updated. |
| 84 20038 70 AVENUE | $625,000 | $597,000 | 4.69 | $629,900 | 23-Sep-2020 | 2007 | 01-Oct-2020 | 1,602 | $390 | |
| 47 20460 66 AVENUE | $500,000 | $486,000 | 2.88 | $549,900 | 24-Apr-2019 | 2004 | 01-Oct-2020 | 1,310 | $381 | |
| 158 20391 96 AVENUE | $550,000 | $584,000 | -5.82 | $559,900 | 25-Sep-2020 | 1992 | 01-Oct-2020 | 1,569 | $350 | |
| 14 19790 55A AVENUE | $585,000 | $606,000 | -3.47 | $579,900 | 14-Aug-2019 | 2019 | 01-Oct-2020 | 1,351 | $433 | |
| 125 9045 WALNUT GROVE DRIVE | $547,000 | $521,000 | 4.99 | $559,000 | 24-Sep-2020 | 1989 | 01-Oct-2020 | 1,571 | $348 | |
| 2 8250 209B STREET | $532,000 | $516,000 | 3.10 | $499,900 | 24-Sep-2020 | 2010 | 01-Oct-2020 | 1,280 | $415 | Renovated/updated. |
| 44 5191 204 STREET | $347,500 | $338,200 | 2.75 | $395,000 | 06-Jul-2020 | 1974 | 02-Oct-2020 | 1,050 | $330 | |
| 170 20033 70 AVENUE | $550,000 | $459,000 | 19.83 | $560,000 | 23-Sep-2020 | 2004 | 02-Oct-2020 | 1,302 | $422 | |
| 62 7848 209 STREET | $570,005 | $539,000 | 5.75 | $549,900 | 29-Sep-2020 | 2013 | 02-Oct-2020 | 1,184 | $481 | |
| 4 9036 208 STREET | $510,000 | $480,000 | 6.25 | $514,800 | 16-Sep-2020 | 1995 | 03-Oct-2020 | 1,463 | $348 | Renovated/updated. |
| 17 20449 66 AVENUE | $565,000 | $538,000 | 5.02 | $569,800 | 16-Sep-2020 | 2004 | 03-Oct-2020 | 1,448 | $390 | |
| 71 20738 84 AVENUE | $759,000 | $728,000 | 4.26 | $759,000 | 21-Sep-2020 | 2011 | 04-Oct-2020 | 2,052 | $369 | |
| 97 20498 82 AVENUE | $661,000 | $618,000 | 6.96 | $678,000 | 21-Sep-2020 | 2016 | 04-Oct-2020 | 1,423 | $464 | |
| 24 8050 204 STREET | $635,000 | $551,000 | 15.25 | $717,700 | 05-Sep-2018 | 2018 | 05-Oct-2020 | 1,436 | $442 | |
| 19 8568 209 STREET | $725,000 | $754,000 | -3.85 | $768,000 | 21-Jul-2020 | 2002 | 05-Oct-2020 | 2,312 | $313 | |
| 14 20967 76 AVENUE | $589,000 | $574,000 | 2.61 | $579,000 | 30-Sep-2020 | 2012 | 05-Oct-2020 | 1,384 | $425 | |
| 2 6888 208 STREET | $538,000 | $552,000 | -2.54 | $639,000 | 16-Jul-2020 | 2010 | 06-Oct-2020 | 1,693 | $317 | |
| 402 5074 201A STREET | $535,000 | $455,100 | 17.56 | $549,900 | 24-Sep-2020 | 1983 | 06-Oct-2020 | 2,212 | $241 | Renovated/updated. |
| 25 19752 55A AVENUE | $595,000 | $572,000 | 4.02 | $615,000 | 16-Sep-2020 | 2014 | 07-Oct-2020 | 1,826 | $325 | |
| 36 8138 204 STREET | $655,000 | $575,000 | 13.91 | $650,000 | 30-Sep-2020 | 2016 | 08-Oct-2020 | 1,403 | $466 | |
| 1101 21937 48 AVENUE | $592,500 | $477,000 | 24.21 | $579,000 | 08-Oct-2020 | 1990 | 09-Oct-2020 | 1,547 | $382 | Renovated/updated. |
4 out of 27 unrenovated resale homes sold below assessed with a median sold price of 4.69
Maple Ridge
| Address | Sold Price | Assessed | % Δ | True List Price | True List Date | Year Built | Sold Date | Sqft | Price per sqft | Notes |
|---|---|---|---|---|---|---|---|---|---|---|
| 87 12099 237 STREET | $399,900 | $358,300 | 11.61 | $399,900 | 15-Sep-2020 | 1993 | 24-Sep-2020 | 1,050 | $380 | Renovated/updated. |
| 23 20799 119 AVENUE | $299,500 | $284,000 | 5.46 | $299,500 | 05-Sep-2020 | 1987 | 24-Sep-2020 | 890 | $336 | Renovated/updated. |
| 21 12071 232B STREET | $500,000 | $390,000 | 28.21 | $524,900 | 07-Jul-2020 | 1991 | 25-Sep-2020 | 1,216 | $411 | Renovated/updated. |
| 17 11355 236 STREET | $561,000 | $501,000 | 11.98 | $594,500 | 02-Jul-2020 | 1999 | 25-Sep-2020 | 1,557 | $360 | Renovated/updated. |
| 89 11305 240 STREET | $574,900 | $470,000 | 22.32 | $584,900 | 18-Sep-2020 | 2015 | 26-Sep-2020 | 1,267 | $453 | |
| 2 12191 228 STREET | $740,550 | $703,000 | 5.34 | $739,900 | 25-Sep-2020 | 2009 | 27-Sep-2020 | 2,740 | $270 | |
| 14 24108 104 AVENUE | $591,500 | $469,000 | 26.12 | $585,000 | 20-Sep-2019 | 2018 | 27-Sep-2020 | 1,601 | $369 | |
| 127 22555 116 AVENUE | $420,000 | $396,800 | 5.85 | $448,800 | 02-Feb-2020 | 1991 | 27-Sep-2020 | 1,312 | $320 | Renovated/updated. |
| 11 21491 DEWDNEY TRUNK ROAD | $448,000 | $394,600 | 13.53 | $460,000 | 10-Sep-2020 | 1990 | 28-Sep-2020 | 1,226 | $365 | Renovated/updated. |
| 33 10525 240 STREET | $675,000 | $648,000 | 4.17 | $710,000 | 13-Jul-2020 | 2016 | 28-Sep-2020 | 2,337 | $288 | Renovated/updated. |
| 84 24108 104 AVENUE | $619,900 | $630,000 | -1.60 | $619,900 | 28-Jul-2020 | 2018 | 28-Sep-2020 | 1,697 | $365 | Brand New. |
| 7 12334 224 STREET | $390,000 | $373,000 | 4.56 | $399,900 | 27-Jul-2020 | 1986 | 28-Sep-2020 | 1,156 | $337 | |
| 11 12334 224 STREET | $420,000 | $373,000 | 12.60 | $429,900 | 28-Sep-2020 | 1986 | 28-Sep-2020 | 1,113 | $377 | Renovated/updated. |
| 1 13260 236 STREET | $628,000 | $521,000 | 20.54 | $639,900 | 21-Sep-2020 | 2017 | 30-Sep-2020 | 1,614 | $389 | |
| 70 13819 232 STREET | $591,000 | $551,000 | 7.26 | $579,900 | 29-Sep-2020 | 2010 | 30-Sep-2020 | 1,541 | $383 | |
| 3 13819 232 STREET | $660,000 | $660,000 | 0.00 | $660,000 | 28-Sep-2020 | 2010 | 02-Oct-2020 | 2,032 | $324 | Renovated/updated. |
| 36 11229 232 STREET | $499,000 | $470,000 | 6.17 | $499,000 | 10-Sep-2020 | 1994 | 02-Oct-2020 | 1,255 | $397 | |
| 8 22280 124 AVENUE | $585,000 | $521,000 | 12.28 | $589,000 | 23-Sep-2020 | 1992 | 03-Oct-2020 | 1,548 | $377 | Renovated/updated. |
| 18 24086 104 AVENUE | $643,500 | $383,800 | 67.67 | $639,900 | 30-Sep-2020 | 2018 | 03-Oct-2020 | 1,503 | $428 | |
| 1 24185 106B AVENUE | $815,000 | $762,000 | 6.96 | $815,000 | 28-Sep-2020 | 2007 | 04-Oct-2020 | 3,024 | $269 | |
| 6 12227 SKILLEN STREET | $485,000 | $474,500 | 2.21 | $515,000 | 29-Jul-2020 | 1983 | 04-Oct-2020 | 1,137 | $426 | |
| 42 22308 124 AVENUE | $325,000 | $388,000 | -16.24 | $337,000 | 04-Aug-2020 | 1989 | 04-Oct-2020 | 1,195 | $271 | |
| 3 20985 CAMWOOD AVENUE | $511,000 | $471,000 | 8.49 | $519,000 | 22-Sep-2020 | 1996 | 06-Oct-2020 | 1,400 | $365 | Renovated/updated. |
| 8 20841 DEWDNEY TRUNK ROAD | $610,000 | $536,000 | 13.81 | $649,900 | 06-Aug-2020 | 1993 | 06-Oct-2020 | 1,718 | $355 | Renovated/updated. |
| 44 11305 240 STREET | $542,000 | $561,000 | -3.39 | $575,000 | 06-Dec-2018 | 2015 | 07-Oct-2020 | 1,401 | $386 | Renovated/updated. |
| 30 11461 236 STREET | $777,000 | $717,000 | 8.37 | $819,900 | 28-May-2020 | 2015 | 07-Oct-2020 | 2,206 | $352 | Renovated/updated. |
| 3 23651 132 AVENUE | $635,000 | $629,000 | 0.95 | $639,999 | 14-Sep-2020 | 2017 | 08-Oct-2020 | 1,708 | $371 | Renovated/updated. |
| 55 24108 104 AVENUE | $647,000 | $442,000 | 46.38 | $649,900 | 06-Oct-2020 | 2018 | 11-Oct-2020 | 1,579 | $409 | |
| 141 11305 240 STREET | $600,000 | $519,000 | 15.61 | $559,900 | 19-Sep-2020 | 2015 | 12-Oct-2020 | 1,499 | $400 | Renovated/updated. |
2 out of 13 unrenovated resale homes sold below assessed with a median sold price of 6.96
White Rock
| Address | Sold Price | Assessed | % Δ | True List Price | True List Date | Year Built | Sold Date | Sqft | Price per sqft | Notes |
|---|---|---|---|---|---|---|---|---|---|---|
| 1426 NICHOL ROAD | $602,500 | $556,800 | 8.21 | $599,900 | 16-Sep-2020 | 1972 | 25-Sep-2020 | 1,890 | $318 | Renovated/updated. |
| 3 1321 FIR STREET | $790,000 | $843,000 | -6.29 | $809,900 | 24-Jul-2020 | 2014 | 08-Oct-2020 | 1,400 | $564 |
1 out of 1 unrenovated resale homes sold below assessed with a median sold price of -6.29
Lions Bay
| Address | Sold Price | Assessed | % Δ | True List Price | True List Date | Year Built | Sold Date | Sqft | Price per sqft | Notes |
|---|---|---|---|---|---|---|---|---|---|---|
| 428 CROSSCREEK ROAD | $815,000 | $706,400 | 15.37 | $959,000 | 16-Nov-2018 | 1970 | 28-Sep-2020 | 1,309 | $622 | Renovated/updated. |
0 out of 0 unrenovated resale homes sold below assessed with a median sold price of 0.00