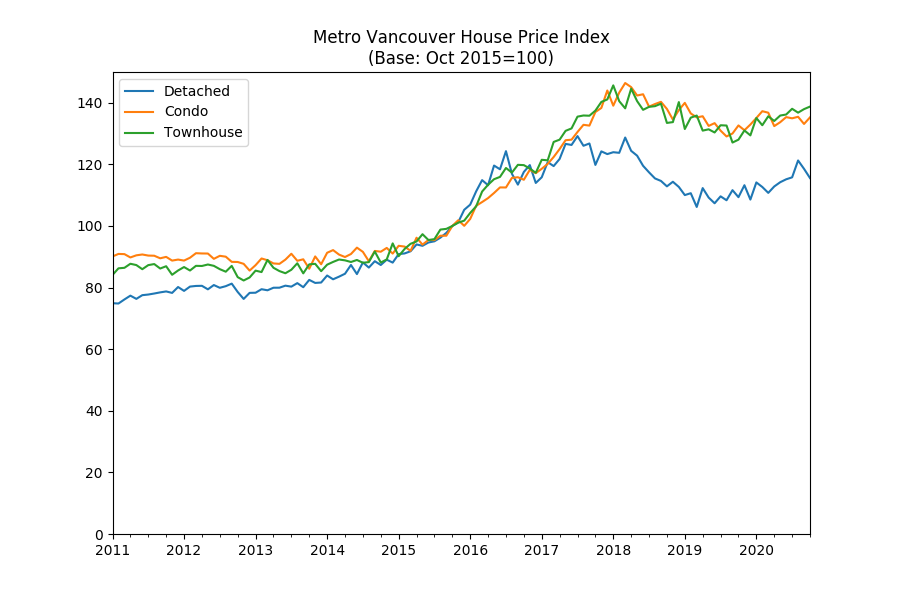
Metro Vancouver condo prices inched up in October 2020, an analysis of housing market data shows.
The OpenHousing Home Price Index for condo properties – calculated using the generally-accepted and transparent repeat sales or Case-Shiller method1 – rose 1.97% year-over-year, the October month-end update shows. This represents a decrease of 1.61% compared to September.
The OpenHousing Home Price Index covers Vancouver, Richmond, Burnaby, West Vancouver, New Westminster, North Vancouver, Delta, Surrey, Port Moody, Coquitlam, Port Coquitlam, Pitt Meadows, Maple Ridge, Lions Bay, Bower Island, Anmore, and Belcarra, Langley and White Rock. Data for Vancouver also include University British Columbia and University Endowment Lands.
Here’s what condo sales looked like in the last 30 days.
Vancouver
| Address | Sold Price | Assessed | % Δ | True List Price | True List Date | Year Built | Sold Date | Sqft | Price per sqft | Notes |
|---|---|---|---|---|---|---|---|---|---|---|
| 602 5033 CAMBIE STREET | $1,600,000 | $1,270,000 | 25.98 | $1,588,000 | 28-May-2020 | 2019 | 08-Oct-2020 | 1,314 | $1,217 | Brand New. |
| 303 5665 BOUNDARY ROAD | $499,900 | $482,000 | 3.71 | $548,000 | 08-Sep-2020 | 2016 | 08-Oct-2020 | 570 | $877 | |
| 1506 63 KEEFER PLACE | $540,000 | $532,000 | 1.50 | $599,999 | 12-Mar-2020 | 2000 | 08-Oct-2020 | 575 | $939 | |
| 1208 8588 CORNISH STREET | $868,000 | $891,000 | -2.58 | $950,000 | 24-Mar-2020 | 2014 | 08-Oct-2020 | 842 | $1,030 | |
| 313 5981 GRAY AVENUE | $932,000 | $1,002,000 | -6.99 | $968,000 | 24-Sep-2020 | 2013 | 08-Oct-2020 | 991 | $940 | |
| 3201 1499 W PENDER STREET | $3,728,800 | $3,417,000 | 9.12 | ? | 16-Jun-2011 | 2011 | 08-Oct-2020 | 2,019 | $1,846 | |
| 112 588 E 5TH AVENUE | $523,000 | $426,400 | 22.65 | $538,000 | 14-Sep-2020 | 1973 | 08-Oct-2020 | 673 | $777 | |
| 2702 1455 HOWE STREET | $980,000 | $1,051,000 | -6.76 | $1,098,000 | 03-Aug-2020 | 2007 | 08-Oct-2020 | 859 | $1,140 | |
| 1603 5615 HAMPTON PLACE | $1,588,000 | $1,802,000 | -11.88 | $1,850,000 | 26-Aug-2019 | 1997 | 08-Oct-2020 | 1,852 | $857 | Renovated/updated. |
| 2313 89 NELSON STREET | $785,000 | $759,000 | 3.43 | $785,000 | 02-Oct-2020 | 2019 | 08-Oct-2020 | 517 | $1,518 | |
| 102 1688 E 8TH AVENUE | $515,500 | $560,000 | -7.95 | $550,000 | 08-Sep-2020 | 1997 | 08-Oct-2020 | 698 | $738 | |
| 902 88 W 1ST AVENUE | $649,000 | $623,000 | 4.17 | $649,000 | 05-Oct-2020 | 2015 | 09-Oct-2020 | 562 | $1,154 | |
| 908 989 BEATTY STREET | $499,000 | $456,000 | 9.43 | $509,000 | 16-Sep-2020 | 2004 | 09-Oct-2020 | 455 | $1,096 | |
| 312 1350 COMOX STREET | $510,000 | $479,900 | 6.27 | $518,000 | 05-Oct-2020 | 1982 | 09-Oct-2020 | 648 | $787 | Renovated/updated. |
| 1003 930 CAMBIE STREET | $815,000 | $708,000 | 15.11 | $849,000 | 11-Aug-2020 | 1994 | 09-Oct-2020 | 1,092 | $746 | |
| 502 3263 PIERVIEW CRESCENT | $696,000 | $761,000 | -8.54 | $759,000 | 04-Aug-2020 | 2016 | 09-Oct-2020 | 1,041 | $668 | |
| 312 3289 RIVERWALK AVENUE | $661,000 | $629,000 | 5.09 | $668,800 | 21-Sep-2020 | 2018 | 09-Oct-2020 | 932 | $709 | |
| 301 531 BEATTY STREET | $815,000 | $797,000 | 2.26 | $899,000 | 08-Jul-2020 | 2007 | 09-Oct-2020 | 931 | $875 | |
| 307 1106 PACIFIC STREET | $418,000 | $451,700 | -7.46 | $439,000 | 02-Oct-2020 | 1984 | 09-Oct-2020 | 549 | $761 | |
| 203 1935 W 1ST AVENUE | $860,000 | $808,000 | 6.44 | $889,000 | 08-Sep-2020 | 1982 | 09-Oct-2020 | 912 | $942 | Renovated/updated. |
| 412 3289 RIVERWALK AVENUE | $655,000 | $640,000 | 2.34 | $504,900 | 19-Apr-2016 | 2018 | 10-Oct-2020 | 932 | $702 | |
| 302 2580 TOLMIE STREET | $1,162,000 | $1,131,000 | 2.74 | $1,299,000 | 25-Sep-2019 | 1995 | 10-Oct-2020 | 1,578 | $736 | |
| 56 1425 LAMEY’S MILL ROAD | $830,000 | $1,053,000 | -21.18 | $1,050,000 | 03-Sep-2019 | 1982 | 10-Oct-2020 | 2,274 | $364 | |
| 2601 1205 W HASTINGS STREET | $1,500,000 | $1,493,000 | 0.47 | $1,695,000 | 17-Aug-2020 | 2007 | 10-Oct-2020 | 1,100 | $1,363 | |
| 813 1177 HORNBY STREET | $568,000 | $511,000 | 11.15 | $599,000 | 03-Aug-2020 | 1994 | 10-Oct-2020 | 670 | $847 | Renovated/updated. |
| 201 6333 WEST BOULEVARD | $2,378,000 | $2,383,000 | -0.21 | $2,480,000 | 07-Sep-2020 | 2019 | 10-Oct-2020 | 1,645 | $1,445 | |
| 301 1675 HORNBY STREET | $1,170,000 | $1,260,000 | -7.14 | $1,299,000 | 22-Jul-2020 | 1986 | 10-Oct-2020 | 1,338 | $874 | Renovated/updated. |
| 317 2416 W 3RD AVENUE | $570,000 | $531,900 | 7.16 | $588,000 | 05-Oct-2020 | 1977 | 10-Oct-2020 | 655 | $870 | Renovated/updated. |
| 510 3462 ROSS DRIVE | $980,000 | $1,127,000 | -13.04 | $1,180,000 | 31-Jul-2020 | 2015 | 10-Oct-2020 | 1,020 | $960 | |
| 312 3333 MAIN STREET | $684,000 | $664,000 | 3.01 | $689,900 | 29-Sep-2020 | 2011 | 10-Oct-2020 | 724 | $944 | Renovated/updated. |
| 608 27 ALEXANDER STREET | $621,000 | $686,000 | -9.48 | $748,880 | 07-Oct-2019 | 1997 | 11-Oct-2020 | 698 | $889 | Renovated/updated. |
| 105 888 W 13TH AVENUE | $679,900 | $608,000 | 11.83 | $699,900 | 15-Sep-2020 | 1987 | 11-Oct-2020 | 705 | $964 | |
| 2005 128 W CORDOVA STREET | $549,000 | $592,000 | -7.26 | $564,900 | 29-Sep-2020 | 2009 | 11-Oct-2020 | 646 | $849 | |
| 203 215 E 33RD AVENUE | $525,000 | $500,000 | 5.00 | $559,000 | 09-Sep-2020 | 2011 | 11-Oct-2020 | 667 | $787 | |
| 302 2173 W 6TH AVENUE | $475,000 | $487,200 | -2.50 | $489,000 | 07-Oct-2020 | 1980 | 11-Oct-2020 | 525 | $904 | |
| 214 1435 NELSON STREET | $675,000 | $619,300 | 8.99 | $689,000 | 21-Sep-2020 | 1976 | 11-Oct-2020 | 723 | $933 | Renovated/updated. |
| 1402 1139 W CORDOVA STREET | $5,720,000 | $5,778,000 | -1.00 | $6,388,000 | 27-Aug-2020 | 2008 | 11-Oct-2020 | 2,400 | $2,383 | |
| 402 1863 ALBERNI STREET | $1,080,000 | $943,000 | 14.53 | $1,099,000 | 28-Sep-2020 | 2002 | 11-Oct-2020 | 987 | $1,094 | |
| 113 3163 RIVERWALK AVENUE | $754,000 | $765,000 | -1.44 | $788,000 | 05-Oct-2020 | 2013 | 11-Oct-2020 | 1,047 | $720 | |
| 3201 1288 W GEORGIA STREET | $670,000 | $682,000 | -1.76 | $670,000 | 06-Oct-2020 | 1998 | 11-Oct-2020 | 603 | $1,111 | |
| 2305 488 SW MARINE DRIVE | $557,000 | $508,000 | 9.65 | $599,000 | 30-Sep-2020 | 2015 | 11-Oct-2020 | 494 | $1,127 | |
| 218 22 E CORDOVA STREET | $340,000 | $340,400 | -0.12 | $299,000 | 05-Oct-2020 | 1996 | 12-Oct-2020 | 395 | $860 | |
| 305 3400 SE MARINE DRIVE | $410,000 | $424,000 | -3.30 | $449,900 | 25-May-2020 | 1992 | 12-Oct-2020 | 864 | $474 | |
| 1709 1618 QUEBEC STREET | $790,000 | $753,000 | 4.91 | $810,000 | 06-Oct-2020 | 2014 | 12-Oct-2020 | 708 | $1,115 | |
| 107 825 W 7TH AVENUE | $730,000 | $756,000 | -3.44 | $730,000 | 05-Oct-2020 | 1986 | 12-Oct-2020 | 844 | $864 | |
| 504 983 E HASTINGS STREET | $483,000 | $494,000 | -2.23 | $488,000 | 15-Sep-2020 | 2018 | 12-Oct-2020 | 575 | $840 | |
| 903 565 SMITHE STREET | $885,000 | $791,000 | 11.88 | $968,500 | 24-Feb-2020 | 2009 | 12-Oct-2020 | 809 | $1,093 | |
| 321 289 E 6TH AVENUE | $610,000 | $581,000 | 4.99 | $628,880 | 25-Sep-2020 | 2015 | 12-Oct-2020 | 601 | $1,014 | |
| 2005 1067 MARINASIDE CRESCENT | $1,075,000 | $1,142,000 | -5.87 | $1,298,000 | 10-Aug-2020 | 2002 | 12-Oct-2020 | 974 | $1,103 | |
| 2102 1028 BARCLAY STREET | $1,330,000 | $1,341,000 | -0.82 | $1,388,000 | 26-Aug-2020 | 2011 | 12-Oct-2020 | 1,054 | $1,261 | Renovated/updated. |
| 2601 1033 MARINASIDE CRESCENT | $941,500 | $900,000 | 4.61 | $969,999 | 02-Oct-2020 | 2002 | 12-Oct-2020 | 764 | $1,232 | Renovated/updated. |
| 2106 838 W HASTINGS STREET | $1,870,000 | $1,827,000 | 2.35 | ? | 18-Mar-2011 | 2011 | 12-Oct-2020 | 1,755 | $1,065 | |
| 104 458 W 63RD AVENUE | $1,380,900 | $1,258,000 | 9.77 | $1,645,900 | 27-Nov-2019 | 2019 | 12-Oct-2020 | 1,262 | $1,094 | |
| 1705 285 E 10TH AVENUE | $1,000,000 | $1,007,000 | -0.70 | $1,039,000 | 05-Oct-2020 | 2019 | 13-Oct-2020 | 904 | $1,106 | |
| 202 1750 MAPLE STREET | $611,555 | $588,900 | 3.85 | $599,000 | 07-Oct-2020 | 1975 | 13-Oct-2020 | 720 | $849 | Renovated/updated. |
| 202 1450 PENNYFARTHING DRIVE | $930,000 | $965,000 | -3.63 | $930,000 | 21-Sep-2020 | 1983 | 13-Oct-2020 | 1,351 | $688 | Renovated/updated. |
| 216 688 E 17TH AVENUE | $865,000 | $742,000 | 16.58 | $799,000 | 26-Sep-2016 | 2008 | 13-Oct-2020 | 958 | $902 | |
| 1501 8189 CAMBIE STREET | $550,688 | $499,000 | 10.36 | $618,000 | 16-Mar-2020 | 2017 | 13-Oct-2020 | 440 | $1,251 | |
| 811 489 INTERURBAN WAY | $562,000 | $492,000 | 14.23 | $579,000 | 27-Aug-2020 | 2015 | 13-Oct-2020 | 576 | $975 | |
| 603 27 ALEXANDER STREET | $623,000 | $609,000 | 2.30 | $679,000 | 26-May-2020 | 1995 | 13-Oct-2020 | 713 | $873 | |
| 1403 969 RICHARDS STREET | $613,300 | $623,000 | -1.56 | $699,000 | 27-Mar-2020 | 2002 | 13-Oct-2020 | 654 | $937 | |
| 307 2416 W 3RD AVENUE | $516,000 | $491,200 | 5.05 | $499,000 | 02-Oct-2020 | 1977 | 13-Oct-2020 | 585 | $882 | Renovated/updated. |
| 2402 535 NICOLA STREET | $5,900,000 | $5,433,000 | 8.60 | ? | 26-Apr-2011 | 1997 | 13-Oct-2020 | 3,090 | $1,909 | |
| 101 2181 W 10TH AVENUE | $565,000 | $542,000 | 4.24 | $549,900 | 07-Oct-2020 | 1997 | 13-Oct-2020 | 594 | $951 | |
| 520 289 E 6TH AVENUE | $609,900 | $595,000 | 2.50 | $609,900 | 08-Oct-2020 | 2015 | 13-Oct-2020 | 560 | $1,089 | Renovated/updated. |
| 19 1101 W 8TH AVENUE | $499,000 | $410,100 | 21.68 | $499,000 | 05-Oct-2020 | 1985 | 13-Oct-2020 | 545 | $915 | Renovated/updated. |
| 405 1345 W 4TH AVENUE | $740,000 | $653,700 | 13.20 | $749,900 | 01-Oct-2020 | 1985 | 13-Oct-2020 | 789 | $937 | Renovated/updated. |
| 2202 1455 HOWE STREET | $980,000 | $1,008,000 | -2.78 | $899,000 | 28-Sep-2020 | 2007 | 13-Oct-2020 | 857 | $1,143 | |
| 1204 1500 HOWE STREET | $975,000 | $954,000 | 2.20 | $1,088,000 | 10-Jun-2020 | 1989 | 13-Oct-2020 | 1,141 | $854 | Renovated/updated. |
| 3502 5665 BOUNDARY ROAD | $846,000 | $851,000 | -0.59 | $966,000 | 11-Jul-2019 | 2016 | 13-Oct-2020 | 931 | $908 | |
| 203 1420 E 7TH AVENUE | $555,000 | $493,200 | 12.53 | $559,000 | 06-Oct-2020 | 1974 | 13-Oct-2020 | 927 | $598 | |
| 312 3133 RIVERWALK AVENUE | $642,000 | $648,000 | -0.93 | $759,000 | 16-Apr-2019 | 2013 | 14-Oct-2020 | 926 | $693 | |
| 1803 1238 RICHARDS STREET | $749,000 | $759,000 | -1.32 | $759,000 | 01-Oct-2020 | 1998 | 14-Oct-2020 | 787 | $951 | Renovated/updated. |
| 208 1260 W 10TH AVENUE | $535,000 | $502,200 | 6.53 | $539,800 | 28-Sep-2020 | 1976 | 14-Oct-2020 | 713 | $750 | |
| 202 328 E 11TH AVENUE | $900,000 | $809,000 | 11.25 | $825,000 | 05-Oct-2020 | 2006 | 14-Oct-2020 | 890 | $1,011 | |
| 701 1283 HOWE STREET | $575,000 | $554,000 | 3.79 | $618,000 | 19-Sep-2020 | 2019 | 14-Oct-2020 | 529 | $1,086 | |
| 812 89 NELSON STREET | $685,000 | $684,000 | 0.15 | $688,000 | 02-Oct-2020 | 2019 | 14-Oct-2020 | 500 | $1,370 | |
| 318 265 E 15TH AVENUE | $747,000 | $666,400 | 12.09 | $739,000 | 07-Oct-2020 | 1976 | 14-Oct-2020 | 864 | $864 | Renovated/updated. |
| 202 1405 W 15TH AVENUE | $500,000 | $580,100 | -13.81 | $498,800 | 29-Sep-2020 | 1977 | 14-Oct-2020 | 733 | $682 | Renovated/updated. |
| 909 3557 SAWMILL CRESCENT | $755,500 | $776,000 | -2.64 | $834,999 | 31-Aug-2020 | 2018 | 14-Oct-2020 | 935 | $808 | |
| 610 5598 ORMIDALE STREET | $525,000 | $552,000 | -4.89 | $559,000 | 24-Aug-2020 | 2016 | 14-Oct-2020 | 614 | $855 | |
| 2207 583 BEACH CRESCENT | $820,000 | $857,000 | -4.32 | $849,900 | 31-Aug-2020 | 2005 | 14-Oct-2020 | 731 | $1,121 | |
| 310 933 SEYMOUR STREET | $565,000 | $552,000 | 2.36 | $599,000 | 23-Aug-2020 | 1998 | 15-Oct-2020 | 646 | $874 | Renovated/updated. |
| 1001 1783 MANITOBA STREET | $741,800 | $731,000 | 1.48 | $749,800 | 06-Oct-2020 | 2015 | 15-Oct-2020 | 726 | $1,021 | Renovated/updated. |
| 5001 1480 HOWE STREET | $3,750,000 | $3,687,000 | 1.71 | $5,488,000 | 28-Mar-2016 | 2020 | 15-Oct-2020 | 2,034 | $1,843 | Brand New. |
| 815 8488 CORNISH STREET | $588,800 | $545,000 | 8.04 | $609,000 | 15-Sep-2020 | 2014 | 15-Oct-2020 | 573 | $1,027 | |
| 1607 1225 RICHARDS STREET | $480,000 | $416,000 | 15.38 | $489,000 | 09-Oct-2020 | 2003 | 15-Oct-2020 | 395 | $1,215 | |
| 416 738 E 29TH AVENUE | $712,000 | $600,000 | 18.67 | $668,000 | 05-Oct-2020 | 2011 | 15-Oct-2020 | 666 | $1,069 | |
| 105 1525 PENDRELL STREET | $650,000 | $616,000 | 5.52 | $699,000 | 20-Aug-2020 | 1987 | 15-Oct-2020 | 780 | $833 | Renovated/updated. |
| 103 2216 W 3RD AVENUE | $607,500 | $632,000 | -3.88 | $649,900 | 25-Aug-2020 | 1988 | 15-Oct-2020 | 646 | $940 | |
| 813 2799 YEW STREET | $975,000 | $1,191,000 | -18.14 | $1,050,000 | 18-Aug-2020 | 2001 | 15-Oct-2020 | 1,167 | $835 | |
| 1303 819 HAMILTON STREET | $533,000 | $584,000 | -8.73 | $599,900 | 03-Sep-2020 | 1998 | 15-Oct-2020 | 552 | $965 | |
| 101 2215 MCGILL STREET | $524,900 | $504,000 | 4.15 | $524,900 | 08-Oct-2020 | 1988 | 15-Oct-2020 | 866 | $606 | |
| 1503 811 HELMCKEN STREET | $758,500 | $630,000 | 20.40 | $749,999 | 05-Oct-2020 | 1994 | 15-Oct-2020 | 774 | $979 | Renovated/updated. |
| 1104 590 NICOLA STREET | $1,850,000 | $1,777,000 | 4.11 | $2,288,000 | 22-Jul-2019 | 2003 | 15-Oct-2020 | 1,235 | $1,497 | Renovated/updated. |
| 1304 1155 HOMER STREET | $610,000 | $623,000 | -2.09 | $429,800 | 15-Apr-2011 | 1994 | 15-Oct-2020 | 688 | $886 | |
| 2306 999 SEYMOUR STREET | $643,000 | $573,000 | 12.22 | $688,000 | 05-Oct-2020 | 2014 | 15-Oct-2020 | 507 | $1,268 | |
| 1203 1570 W 7TH AVENUE | $745,000 | $700,000 | 6.43 | $749,900 | 21-Aug-2020 | 2002 | 15-Oct-2020 | 918 | $811 | Renovated/updated. |
| 103 1465 COMOX STREET | $700,000 | $600,000 | 16.67 | $750,000 | 12-Mar-2018 | 1988 | 15-Oct-2020 | 789 | $887 | |
| 1705 110 SWITCHMEN STREET | $1,250,000 | $1,295,000 | -3.47 | $1,470,000 | 24-Sep-2020 | 2014 | 15-Oct-2020 | 1,023 | $1,221 | |
| 203 1740 COMOX STREET | $500,000 | $486,000 | 2.88 | $549,000 | 03-Jul-2020 | 1976 | 15-Oct-2020 | 627 | $797 | Renovated/updated. |
| 2305 1155 HOMER STREET | $1,200,000 | $1,169,000 | 2.65 | $1,358,000 | 21-Sep-2020 | 1994 | 16-Oct-2020 | 1,051 | $1,141 | Renovated/updated. |
| 808 2321 SCOTIA STREET | $920,000 | $896,000 | 2.68 | $948,800 | 29-Sep-2020 | 2011 | 16-Oct-2020 | 868 | $1,059 | Renovated/updated. |
| 103 1415 W GEORGIA STREET | $948,000 | $980,000 | -3.27 | $998,000 | 14-Sep-2020 | 1990 | 16-Oct-2020 | 1,206 | $786 | |
| 3607 188 KEEFER PLACE | $865,000 | $881,000 | -1.82 | $898,000 | 13-Oct-2020 | 2009 | 16-Oct-2020 | 841 | $1,028 | |
| 903 2221 E 30TH AVENUE | $485,000 | $457,000 | 6.13 | $518,000 | 14-Sep-2020 | 2018 | 16-Oct-2020 | 483 | $1,004 | Renovated/updated. |
| 710 1239 W GEORGIA STREET | $470,000 | $428,000 | 9.81 | $479,900 | 02-Sep-2020 | 1999 | 16-Oct-2020 | 419 | $1,121 | |
| 1003 1331 ALBERNI STREET | $490,000 | $440,000 | 11.36 | $509,000 | 14-Sep-2020 | 1999 | 16-Oct-2020 | 401 | $1,221 | Renovated/updated. |
| 408 1234 PENDRELL STREET | $497,000 | $500,400 | -0.68 | $499,900 | 13-Oct-2020 | 1975 | 16-Oct-2020 | 667 | $745 | Renovated/updated. |
| 306 1205 HOWE STREET | $669,000 | $653,000 | 2.45 | $720,000 | 08-Sep-2020 | 2009 | 16-Oct-2020 | 674 | $992 | |
| 1006 285 E 10TH AVENUE | $630,000 | $623,000 | 1.12 | $599,900 | 04-Jun-2020 | 2019 | 16-Oct-2020 | 583 | $1,080 | Renovated/updated. |
| 401 215 E 33RD AVENUE | $503,500 | $437,000 | 15.22 | $539,000 | 21-Sep-2020 | 2011 | 16-Oct-2020 | 501 | $1,004 | |
| 416 288 E 8TH AVENUE | $750,000 | $632,000 | 18.67 | $715,000 | 13-Oct-2020 | 1996 | 16-Oct-2020 | 780 | $961 | Renovated/updated. |
| 902 1000 BEACH AVENUE | $1,120,000 | $1,117,000 | 0.27 | $1,198,000 | 04-Aug-2020 | 1991 | 17-Oct-2020 | 1,192 | $939 | |
| 1809 433 SW MARINE DRIVE | $880,000 | $897,000 | -1.90 | $928,000 | 28-Aug-2020 | 2019 | 17-Oct-2020 | 760 | $1,157 | |
| 814 933 SEYMOUR STREET | $575,000 | $536,000 | 7.28 | $599,000 | 01-Sep-2020 | 1998 | 17-Oct-2020 | 555 | $1,036 | |
| 106 1429 E 4TH AVENUE | $525,000 | $469,300 | 11.87 | $499,900 | 08-Oct-2020 | 1981 | 17-Oct-2020 | 630 | $833 | Renovated/updated. |
| 215 2238 KINGSWAY | $520,000 | $475,000 | 9.47 | $538,000 | 10-Jul-2020 | 1997 | 17-Oct-2020 | 800 | $650 | Renovated/updated. |
| 305 1585 E 4TH AVENUE | $432,500 | $458,100 | -5.59 | $469,900 | 27-Jul-2020 | 1974 | 17-Oct-2020 | 666 | $649 | |
| 506 298 E 11TH AVENUE | $658,000 | $602,000 | 9.30 | $679,900 | 14-Sep-2020 | 2008 | 17-Oct-2020 | 722 | $911 | Renovated/updated. |
| 307 1561 W 57TH AVENUE | $760,000 | $774,000 | -1.81 | $899,900 | 29-Jan-2018 | 2018 | 18-Oct-2020 | 673 | $1,129 | |
| 701 1833 CROWE STREET | $1,088,000 | $1,026,000 | 6.04 | $1,199,000 | 05-Nov-2018 | 2009 | 18-Oct-2020 | 1,176 | $925 | |
| 617 3557 SAWMILL CRESCENT | $632,000 | $682,000 | -7.33 | $659,000 | 21-Sep-2020 | 2018 | 18-Oct-2020 | 867 | $728 | |
| 309 2636 E HASTINGS STREET | $475,000 | $442,000 | 7.47 | $474,900 | 05-Oct-2020 | 2009 | 18-Oct-2020 | 697 | $681 | |
| 305 4888 NANAIMO STREET | $457,000 | $403,000 | 13.40 | $459,000 | 16-Oct-2020 | 2012 | 18-Oct-2020 | 477 | $958 | |
| 107 55 E 10TH AVENUE | $880,000 | $856,000 | 2.80 | $899,000 | 30-Sep-2020 | 1994 | 18-Oct-2020 | 851 | $1,034 | Renovated/updated. |
| 2607 1199 SEYMOUR STREET | $840,000 | $897,000 | -6.35 | $949,900 | 22-Jul-2020 | 2005 | 18-Oct-2020 | 823 | $1,020 | Renovated/updated. |
| 606 983 E HASTINGS STREET | $440,000 | $379,000 | 16.09 | $489,000 | 08-Sep-2020 | 2018 | 18-Oct-2020 | 434 | $1,013 | |
| 312 1990 W 6TH AVENUE | $690,000 | $561,100 | 22.97 | $749,000 | 24-Aug-2020 | 1980 | 18-Oct-2020 | 729 | $946 | Renovated/updated. |
| 525 289 E 6TH AVENUE | $866,000 | $851,000 | 1.76 | $899,900 | 13-Oct-2020 | 2015 | 18-Oct-2020 | 849 | $1,020 | |
| 1905 1188 RICHARDS STREET | $660,000 | $674,000 | -2.08 | $675,000 | 14-Oct-2020 | 1995 | 18-Oct-2020 | 642 | $1,028 | Renovated/updated. |
| 1606 821 CAMBIE STREET | $879,000 | $908,000 | -3.19 | ? | 11-Jul-2014 | 2008 | 18-Oct-2020 | 885 | $993 | |
| 2509 602 CITADEL PARADE | $660,000 | $674,000 | -2.08 | $689,000 | 06-Oct-2020 | 2007 | 18-Oct-2020 | 656 | $1,006 | |
| 407 2080 E KENT AVENUE SOUTH | $495,000 | $433,000 | 14.32 | $499,900 | 13-Oct-2020 | 1994 | 18-Oct-2020 | 756 | $654 | Renovated/updated. |
| 103 4990 MCGEER STREET | $387,000 | $330,100 | 17.24 | $439,000 | 31-Jul-2020 | 1994 | 18-Oct-2020 | 558 | $693 | |
| 314 3875 W 4TH AVENUE | $545,000 | $521,400 | 4.53 | $549,000 | 13-Oct-2020 | 1977 | 18-Oct-2020 | 662 | $823 | Renovated/updated. |
| 103 1490 PENNYFARTHING DRIVE | $1,232,500 | $949,000 | 29.87 | $1,280,000 | 13-Oct-2020 | 1986 | 19-Oct-2020 | 1,323 | $931 | Renovated/updated. |
| 512 1238 SEYMOUR STREET | $635,000 | $614,000 | 3.42 | $699,000 | 08-Jun-2020 | 1996 | 19-Oct-2020 | 657 | $966 | |
| 411 251 E 7TH AVENUE | $595,000 | $595,000 | 0.00 | $629,000 | 25-Aug-2020 | 2012 | 19-Oct-2020 | 605 | $983 | |
| 308 2102 W 38TH AVENUE | $690,000 | $602,000 | 14.62 | $728,800 | 23-Jul-2020 | 2000 | 19-Oct-2020 | 767 | $899 | |
| 306 7128 ADERA STREET | $1,470,000 | $1,470,000 | 0.00 | $1,890,000 | 17-Oct-2019 | 2019 | 19-Oct-2020 | 1,253 | $1,173 | |
| 243 2565 W BROADWAY | $812,500 | $733,000 | 10.85 | $820,000 | 09-Oct-2020 | 1995 | 19-Oct-2020 | 868 | $936 | Renovated/updated. |
| 1208 1225 RICHARDS STREET | $730,000 | $637,000 | 14.60 | $798,000 | 21-Sep-2020 | 2003 | 19-Oct-2020 | 635 | $1,149 | Renovated/updated. |
| 1201 1128 QUEBEC STREET | $935,000 | $946,000 | -1.16 | $949,900 | 13-Oct-2020 | 1994 | 19-Oct-2020 | 1,078 | $867 | Renovated/updated. |
| 258 2175 SALAL DRIVE | $1,200,000 | $1,068,000 | 12.36 | $1,199,800 | 19-Oct-2020 | 2000 | 19-Oct-2020 | 1,184 | $1,013 | |
| 1809 3520 CROWLEY DRIVE | $554,000 | $565,000 | -1.95 | $588,000 | 04-Aug-2020 | 2001 | 19-Oct-2020 | 727 | $762 | |
| 302 3463 CROWLEY DRIVE | $545,500 | $498,000 | 9.54 | $599,000 | 19-Jun-2020 | 1995 | 19-Oct-2020 | 848 | $643 | |
| 308 2328 OXFORD STREET | $540,000 | $542,000 | -0.37 | $304,900 | 13-Jun-2011 | 1984 | 19-Oct-2020 | 798 | $676 | |
| 304 2330 MAPLE STREET | $521,000 | $486,400 | 7.11 | $575,000 | 14-Jul-2020 | 1974 | 19-Oct-2020 | 622 | $837 | Renovated/updated. |
| 209 750 E 7TH AVENUE | $358,000 | $395,800 | -9.55 | $349,900 | 27-Sep-2020 | 1974 | 19-Oct-2020 | 596 | $600 | Renovated/updated. |
| 901 930 CAMBIE STREET | $810,000 | $855,000 | -5.26 | $990,000 | 10-Feb-2020 | 1994 | 19-Oct-2020 | 1,105 | $733 | |
| 310 161 W GEORGIA STREET | $652,000 | $657,000 | -0.76 | $669,000 | 29-Sep-2020 | 2012 | 19-Oct-2020 | 693 | $940 | Renovated/updated. |
| 1101 1788 W GEORGIA STREET | $1,289,000 | $1,197,000 | 7.69 | $1,269,000 | 14-Oct-2020 | 1990 | 19-Oct-2020 | 1,369 | $941 | |
| 704 1575 W 10TH AVENUE | $944,000 | $944,000 | 0.00 | $998,000 | 27-Jul-2020 | 1998 | 19-Oct-2020 | 1,240 | $761 | |
| 306 638 BEACH CRESCENT | $667,000 | $666,000 | 0.15 | $729,900 | 31-Aug-2020 | 2006 | 20-Oct-2020 | 642 | $1,038 | |
| 311 1823 E GEORGIA STREET | $725,000 | $666,000 | 8.86 | $749,800 | 14-Oct-2020 | 1992 | 20-Oct-2020 | 787 | $921 | Renovated/updated. |
| 1801 918 COOPERAGE WAY | $685,000 | $687,000 | -0.29 | $749,000 | 28-Sep-2020 | 2008 | 20-Oct-2020 | 664 | $1,031 | |
| 102 5760 HAMPTON PLACE | $1,030,000 | $941,000 | 9.46 | $999,000 | 21-Sep-2020 | 1993 | 20-Oct-2020 | 1,403 | $734 | |
| 301 2268 REDBUD LANE | $685,000 | $581,000 | 17.90 | $649,000 | 16-Oct-2020 | 1998 | 20-Oct-2020 | 605 | $1,132 | |
| 1601 888 HOMER STREET | $1,052,000 | $917,000 | 14.72 | $999,000 | 13-Oct-2020 | 2011 | 20-Oct-2020 | 970 | $1,084 | |
| 303 138 TEMPLETON DRIVE | $525,000 | $397,100 | 32.21 | $499,000 | 14-Oct-2020 | 1973 | 20-Oct-2020 | 590 | $889 | Renovated/updated. |
| 316 933 SEYMOUR STREET | $570,000 | $532,000 | 7.14 | $598,000 | 13-Jul-2020 | 1998 | 20-Oct-2020 | 663 | $859 | |
| 909 939 HOMER STREET | $722,000 | $657,000 | 9.89 | $769,000 | 24-Aug-2020 | 1998 | 20-Oct-2020 | 771 | $936 | Renovated/updated. |
| 311 3788 W 8TH AVENUE | $964,380 | $973,000 | -0.89 | $999,999 | 29-Sep-2020 | 1989 | 20-Oct-2020 | 1,101 | $875 | |
| 110 321 E 16TH AVENUE | $622,000 | $577,000 | 7.80 | $624,900 | 09-Oct-2020 | 2019 | 20-Oct-2020 | 574 | $1,083 | |
| 1803 1281 W CORDOVA STREET | $2,155,000 | $2,319,000 | -7.07 | $1,999,000 | 04-Sep-2020 | 2004 | 20-Oct-2020 | 1,253 | $1,719 | |
| 205 1318 W 6TH AVENUE | $950,000 | $1,047,000 | -9.26 | $899,000 | 15-Oct-2020 | 1992 | 21-Oct-2020 | 1,350 | $703 | |
| 104 2333 ETON STREET | $512,500 | $547,000 | -6.31 | $548,000 | 31-Aug-2020 | 1988 | 21-Oct-2020 | 719 | $712 | |
| 401 2108 W 38TH AVENUE | $899,000 | $852,000 | 5.52 | $899,000 | 19-Oct-2020 | 1992 | 21-Oct-2020 | 1,234 | $728 | |
| 1407 445 W 2ND AVENUE | $636,000 | $639,000 | -0.47 | $683,000 | 28-Apr-2020 | 2012 | 21-Oct-2020 | 561 | $1,133 | |
| 308 2028 W 11TH AVENUE | $798,000 | $665,000 | 20.00 | $875,000 | 10-Aug-2020 | 1996 | 21-Oct-2020 | 886 | $900 | Renovated/updated. |
| 202 1178 HAMILTON STREET | $580,000 | $496,000 | 16.94 | $599,000 | 08-Sep-2020 | 1913 | 21-Oct-2020 | 530 | $1,094 | Renovated/updated. |
| 202 12 ATHLETES WAY | $650,000 | $712,000 | -8.71 | $799,000 | 07-Sep-2020 | 2009 | 21-Oct-2020 | 710 | $915 | Renovated/updated. |
| 301 1128 QUEBEC STREET | $900,000 | $925,000 | -2.70 | $1,089,000 | 09-Mar-2020 | 1994 | 21-Oct-2020 | 1,236 | $728 | Renovated/updated. |
| 301 2211 WALL STREET | $715,000 | $681,000 | 4.99 | $719,000 | 14-Oct-2020 | 1994 | 21-Oct-2020 | 917 | $779 | Renovated/updated. |
| 2403 588 BROUGHTON STREET | $773,300 | $765,000 | 1.08 | $799,000 | 16-Oct-2020 | 1995 | 21-Oct-2020 | 589 | $1,312 | |
| 3302 1308 HORNBY STREET | $2,335,000 | $2,041,000 | 14.40 | $3,016,500 | 26-May-2020 | 2014 | 21-Oct-2020 | 1,384 | $1,687 | |
| 208 334 E 5TH AVENUE | $495,000 | $479,500 | 3.23 | $499,000 | 13-Oct-2020 | 1977 | 21-Oct-2020 | 708 | $699 | Renovated/updated. |
| 305 1252 HORNBY STREET | $673,000 | $638,000 | 5.49 | $698,800 | 16-Sep-2020 | 2008 | 22-Oct-2020 | 651 | $1,033 | Renovated/updated. |
| 1106 638 BEACH CRESCENT | $729,000 | $736,000 | -0.95 | $788,000 | 18-Feb-2020 | 2006 | 22-Oct-2020 | 664 | $1,097 | |
| 509 2268 REDBUD LANE | $845,000 | $764,000 | 10.60 | $849,000 | 19-Oct-2020 | 1998 | 22-Oct-2020 | 827 | $1,021 | |
| 1602 1723 ALBERNI STREET | $841,000 | $834,000 | 0.84 | $879,900 | 07-Oct-2020 | 1998 | 22-Oct-2020 | 780 | $1,078 | |
| 305 819 HAMILTON STREET | $475,000 | $408,000 | 16.42 | $479,000 | 07-Oct-2020 | 1998 | 22-Oct-2020 | 405 | $1,172 | |
| 201 1251 W 71ST AVENUE | $513,000 | $474,000 | 8.23 | $538,000 | 03-Oct-2020 | 1982 | 22-Oct-2020 | 838 | $612 | |
| 1B 1500 ALBERNI STREET | $1,195,000 | $1,075,000 | 11.16 | $1,198,000 | 09-Sep-2020 | 1991 | 22-Oct-2020 | 1,360 | $878 | Renovated/updated. |
| 2805 1308 HORNBY STREET | $561,000 | $558,000 | 0.54 | $668,000 | 15-Oct-2018 | 2014 | 22-Oct-2020 | 471 | $1,191 | |
| 505 55 E CORDOVA STREET | $840,000 | $800,000 | 5.00 | $875,000 | 27-Aug-2020 | 2006 | 23-Oct-2020 | 986 | $851 | |
| 402 1550 W 15TH AVENUE | $1,575,000 | $1,533,000 | 2.74 | $1,699,900 | 08-Sep-2020 | 1993 | 23-Oct-2020 | 1,531 | $1,028 | |
| 2802 233 ROBSON STREET | $1,095,000 | $983,000 | 11.39 | $1,188,800 | 22-Sep-2020 | 2009 | 23-Oct-2020 | 959 | $1,141 | |
| 306 683 E 27TH AVENUE | $585,000 | $535,000 | 9.35 | $615,000 | 21-Sep-2020 | 2012 | 23-Oct-2020 | 565 | $1,035 | |
| 516 428 W 8TH AVENUE | $799,000 | $789,000 | 1.27 | $819,000 | 08-Sep-2020 | 1999 | 23-Oct-2020 | 827 | $966 | Renovated/updated. |
| 1005 5288 MELBOURNE STREET | $680,000 | $658,000 | 3.34 | $685,000 | 13-Oct-2020 | 1998 | 23-Oct-2020 | 1,020 | $666 | Renovated/updated. |
| 102 444 E 6TH AVENUE | $655,000 | $639,000 | 2.50 | $680,000 | 29-Sep-2020 | 1974 | 23-Oct-2020 | 975 | $671 | Renovated/updated. |
| 512 6633 CAMBIE STREET | $590,000 | $604,000 | -2.32 | $763,000 | 02-Sep-2020 | 2016 | 23-Oct-2020 | 592 | $996 | |
| 606 6383 CAMBIE STREET | $660,000 | $672,000 | -1.79 | $699,000 | 07-Oct-2020 | 2015 | 23-Oct-2020 | 573 | $1,151 | |
| 302 1729 E GEORGIA STREET | $489,000 | $551,000 | -11.25 | $498,000 | 30-Sep-2020 | 1993 | 23-Oct-2020 | 667 | $733 | Renovated/updated. |
| 312 38 W 1ST AVENUE | $690,000 | $619,000 | 11.47 | $699,999 | 06-Oct-2020 | 2015 | 24-Oct-2020 | 604 | $1,142 | |
| 208 3333 MAIN STREET | $690,000 | $635,000 | 8.66 | $699,900 | 17-Sep-2020 | 2011 | 24-Oct-2020 | 716 | $963 | |
| 206 1545 E 2ND AVENUE | $360,000 | $381,400 | -5.61 | $409,900 | 20-Nov-2019 | 1976 | 25-Oct-2020 | 456 | $789 | Renovated/updated. |
| 202 888 BUTE STREET | $815,000 | $803,000 | 1.49 | $829,900 | 04-Aug-2020 | 1994 | 25-Oct-2020 | 916 | $889 | Renovated/updated. |
| 703 1783 MANITOBA STREET | $700,000 | $703,000 | -0.43 | ? | 08-Aug-2012 | 2015 | 25-Oct-2020 | 712 | $983 | |
| 309 22 E CORDOVA STREET | $395,000 | $373,500 | 5.76 | $408,000 | 23-Sep-2020 | 1996 | 25-Oct-2020 | 408 | $968 | Renovated/updated. |
| 103 738 E 29TH AVENUE | $570,000 | $620,000 | -8.06 | $315,000 | 25-Aug-2020 | 2011 | 25-Oct-2020 | 726 | $785 | |
| 504 977 MAINLAND STREET | $570,000 | $521,000 | 9.40 | $589,900 | 13-Oct-2020 | 2006 | 25-Oct-2020 | 492 | $1,158 | |
| 716 188 KEEFER STREET | $495,000 | $602,000 | -17.77 | $558,000 | 24-Feb-2020 | 2016 | 25-Oct-2020 | 585 | $846 | |
| 206 288 E 14TH AVENUE | $480,000 | $412,000 | 16.50 | $499,900 | 21-Sep-2020 | 1983 | 25-Oct-2020 | 500 | $960 | |
| 505 193 AQUARIUS MEWS | $640,000 | $618,000 | 3.56 | $710,000 | 02-Sep-2020 | 2000 | 25-Oct-2020 | 628 | $1,019 | |
| 406 1178 HAMILTON STREET | $715,000 | $693,000 | 3.17 | $719,900 | 08-Oct-2020 | 1913 | 25-Oct-2020 | 707 | $1,011 | |
| 702 850 BURRARD STREET | $642,000 | $569,000 | 12.83 | $659,000 | 20-Oct-2020 | 1983 | 26-Oct-2020 | 674 | $952 | |
| 219 2768 CRANBERRY DRIVE | $829,000 | $773,000 | 7.24 | $829,000 | 13-Oct-2020 | 2000 | 26-Oct-2020 | 895 | $926 | |
| 413 2929 W 4TH AVENUE | $840,000 | $841,000 | -0.12 | $899,900 | 21-Sep-2020 | 1998 | 26-Oct-2020 | 964 | $871 | Renovated/updated. |
| 310 4355 W 10TH AVENUE | $711,000 | $701,000 | 1.43 | $699,000 | 19-Oct-2020 | 2012 | 26-Oct-2020 | 649 | $1,095 | |
| 412 2511 QUEBEC STREET | $555,000 | $534,000 | 3.93 | $539,000 | 19-Oct-2020 | 2011 | 26-Oct-2020 | 627 | $885 | Renovated/updated. |
| 106 1551 W 11TH AVENUE | $575,000 | $539,300 | 6.62 | $619,000 | 02-Sep-2020 | 1980 | 26-Oct-2020 | 707 | $813 | Renovated/updated. |
| 203 3456 COMMERCIAL STREET | $640,000 | $574,000 | 11.50 | $635,000 | 21-Oct-2020 | 2015 | 26-Oct-2020 | 655 | $977 | |
| 402 1515 E 6TH AVENUE | $765,000 | $764,000 | 0.13 | $699,000 | 22-Oct-2020 | 1991 | 26-Oct-2020 | 837 | $913 | |
| 1508 989 BEATTY STREET | $490,000 | $474,000 | 3.38 | $589,000 | 21-Jan-2019 | 2004 | 27-Oct-2020 | 455 | $1,076 | |
| 1809 939 EXPO BOULEVARD | $585,000 | $582,000 | 0.52 | $599,900 | 26-Aug-2020 | 2005 | 27-Oct-2020 | 506 | $1,156 | |
| 212 2468 BAYSWATER STREET | $1,305,000 | $1,118,000 | 16.73 | $1,189,000 | 21-Oct-2020 | 2014 | 27-Oct-2020 | 1,002 | $1,302 | |
| 204 5350 BALSAM STREET | $655,000 | $587,000 | 11.58 | $699,000 | 13-Oct-2020 | 1973 | 27-Oct-2020 | 1,115 | $587 | Renovated/updated. |
| 309 1990 W 6TH AVENUE | $595,000 | $566,000 | 5.12 | $618,000 | 28-Sep-2020 | 1980 | 27-Oct-2020 | 736 | $808 | Renovated/updated. |
| 510 110 SWITCHMEN STREET | $830,000 | $790,000 | 5.06 | $875,000 | 13-Oct-2020 | 2014 | 28-Oct-2020 | 781 | $1,062 | |
| 2002 989 NELSON STREET | $679,800 | $670,000 | 1.46 | $758,000 | 16-Jun-2020 | 1957 | 28-Oct-2020 | 660 | $1,030 | Renovated/updated. |
| 301 4900 CARTIER STREET | $1,150,000 | $1,057,000 | 8.80 | $1,100,000 | 21-Oct-2020 | 1976 | 28-Oct-2020 | 1,244 | $924 | Renovated/updated. |
| 416 1988 MAPLE STREET | $1,206,100 | $805,000 | 49.83 | $999,000 | 23-Oct-2020 | 1988 | 30-Oct-2020 | 950 | $1,269 | Renovated/updated. |
| 802 928 RICHARDS STREET | $535,000 | $504,000 | 6.15 | $568,000 | 12-Sep-2020 | 2000 | 30-Oct-2020 | 495 | $1,080 | |
| 204 1530 MARINER WALK | $500,000 | $512,000 | -2.34 | $499,900 | 12-Oct-2020 | 1984 | 31-Oct-2020 | 889 | $562 | Renovated/updated. |
| 215 1869 SPYGLASS PLACE | $1,150,000 | $1,028,000 | 11.87 | $1,150,000 | 30-Oct-2020 | 1988 | 31-Oct-2020 | 1,121 | $1,025 | |
| 344 2033 TRIUMPH STREET | $475,000 | $466,100 | 1.91 | ? | 07-Oct-2014 | 1975 | 02-Nov-2020 | 687 | $691 | Renovated/updated. |
52 out of 137 unrenovated resale homes sold below assessed with a median sold price of 2.74
Richmond
| Address | Sold Price | Assessed | % Δ | True List Price | True List Date | Year Built | Sold Date | Sqft | Price per sqft | Notes |
|---|---|---|---|---|---|---|---|---|---|---|
| 1206 7360 ELMBRIDGE WAY | $630,000 | $627,000 | 0.48 | ? | 01-Feb-2011 | 2008 | 08-Oct-2020 | 928 | $678 | |
| 222 8775 JONES ROAD | $543,000 | $512,000 | 6.05 | $549,900 | 22-Sep-2020 | 1993 | 08-Oct-2020 | 1,096 | $495 | |
| 327 8860 NO. 1 ROAD | $402,500 | $376,300 | 6.96 | $414,900 | 08-Sep-2020 | 1973 | 08-Oct-2020 | 929 | $433 | Renovated/updated. |
| 233 5880 DOVER CRESCENT | $408,000 | $426,800 | -4.40 | $410,800 | 23-Sep-2020 | 1995 | 08-Oct-2020 | 674 | $605 | |
| 1102 6088 MINORU BOULEVARD | $840,000 | $925,000 | -9.19 | $929,000 | 17-Sep-2019 | 1997 | 08-Oct-2020 | 1,308 | $642 | Renovated/updated. |
| 710 7831 WESTMINSTER HIGHWAY | $440,000 | $457,000 | -3.72 | $399,900 | 05-Oct-2020 | 2003 | 08-Oct-2020 | 658 | $668 | |
| 310 9311 ALEXANDRA ROAD | $531,000 | $539,000 | -1.48 | $549,000 | 01-Oct-2020 | 2015 | 08-Oct-2020 | 740 | $717 | |
| 811 9171 FERNDALE ROAD | $603,800 | $593,000 | 1.82 | $697,800 | 22-Aug-2018 | 2008 | 08-Oct-2020 | 916 | $659 | |
| 1205 8628 HAZELBRIDGE WAY | $540,000 | $517,000 | 4.45 | $569,900 | 04-Nov-2019 | 2018 | 08-Oct-2020 | 569 | $949 | |
| 304 8400 ANDERSON ROAD | $348,000 | $350,900 | -0.83 | $350,000 | 30-Sep-2020 | 2009 | 08-Oct-2020 | 483 | $720 | |
| 608 8633 CAPSTAN WAY | $520,000 | $459,000 | 13.29 | $545,000 | 05-Oct-2020 | 2016 | 09-Oct-2020 | 556 | $935 | |
| 309 5791 GRANVILLE AVENUE | $290,000 | $260,900 | 11.15 | $299,000 | 03-Sep-2020 | 1980 | 09-Oct-2020 | 770 | $376 | |
| 402 4280 MONCTON STREET | $568,000 | $550,000 | 3.27 | $568,000 | 06-Oct-2020 | 2005 | 10-Oct-2020 | 762 | $745 | Renovated/updated. |
| 312 8080 CAMBIE ROAD | $565,000 | $496,000 | 13.91 | $565,000 | 06-Oct-2020 | 2008 | 10-Oct-2020 | 715 | $790 | |
| 125 9388 MCKIM WAY | $578,000 | $519,000 | 11.37 | $588,000 | 05-Oct-2020 | 2012 | 10-Oct-2020 | 830 | $696 | |
| 505 7708 ALDERBRIDGE WAY | $750,000 | $720,000 | 4.17 | $828,000 | 28-Dec-2018 | 2017 | 10-Oct-2020 | 990 | $757 | |
| 806 8811 LANSDOWNE ROAD | $655,000 | $746,000 | -12.20 | $739,000 | 22-Jul-2020 | 1991 | 10-Oct-2020 | 1,400 | $467 | Renovated/updated. |
| 102 8760 NO. 1 ROAD | $352,500 | $371,500 | -5.11 | $390,000 | 30-Jun-2020 | 1973 | 10-Oct-2020 | 970 | $363 | |
| 1409 8871 LANSDOWNE ROAD | $482,000 | $458,000 | 5.24 | ? | 01-Apr-2013 | 1995 | 10-Oct-2020 | 764 | $630 | Renovated/updated. |
| 207 8220 JONES ROAD | $525,000 | $580,000 | -9.48 | $588,000 | 13-Sep-2018 | 1994 | 11-Oct-2020 | 1,029 | $510 | |
| 905 5171 BRIGHOUSE WAY | $1,065,000 | $975,000 | 9.23 | $1,188,000 | 03-Jun-2020 | 2013 | 11-Oct-2020 | 1,230 | $865 | |
| 107 9199 TOMICKI AVENUE | $578,500 | $578,000 | 0.09 | $579,000 | 21-Sep-2020 | 2009 | 12-Oct-2020 | 929 | $622 | |
| 310 8775 JONES ROAD | $473,000 | $480,000 | -1.46 | $515,000 | 20-May-2020 | 1993 | 12-Oct-2020 | 989 | $478 | |
| 431 9500 ODLIN ROAD | $560,000 | $590,000 | -5.08 | $565,000 | 08-Oct-2020 | 2011 | 12-Oct-2020 | 826 | $677 | |
| 103 5860 DOVER CRESCENT | $461,800 | $397,000 | 16.32 | $448,000 | 25-Sep-2020 | 1997 | 13-Oct-2020 | 713 | $647 | Renovated/updated. |
| 413 9399 ALEXANDRA ROAD | $530,000 | $530,000 | 0.00 | $550,000 | 05-Oct-2020 | 2015 | 13-Oct-2020 | 732 | $724 | |
| 1802 7362 ELMBRIDGE WAY | $1,600,000 | $1,324,000 | 20.85 | $1,880,000 | 19-Aug-2020 | 2008 | 14-Oct-2020 | 1,808 | $884 | |
| 1701 5028 KWANTLEN STREET | $650,000 | $636,000 | 2.20 | $698,000 | 20-Mar-2020 | 2006 | 14-Oct-2020 | 820 | $792 | Renovated/updated. |
| 1701 7831 WESTMINSTER HIGHWAY | $610,000 | $591,000 | 3.21 | ? | 25-Jun-2013 | 2003 | 14-Oct-2020 | 804 | $758 | Renovated/updated. |
| 1009 3300 KETCHESON ROAD | $518,000 | $451,000 | 14.86 | $539,000 | 28-Sep-2020 | 2019 | 14-Oct-2020 | 507 | $1,021 | Brand New. |
| 109 5600 ANDREWS ROAD | $540,000 | $478,000 | 12.97 | $559,000 | 14-Aug-2020 | 1998 | 14-Oct-2020 | 766 | $704 | |
| 1209 6651 MINORU BOULEVARD | $363,500 | $393,500 | -7.62 | $375,000 | 07-Oct-2020 | 1973 | 14-Oct-2020 | 879 | $413 | |
| 382 4133 STOLBERG STREET | $354,000 | $289,000 | 22.49 | $378,000 | 04-Aug-2020 | 2013 | 14-Oct-2020 | 398 | $889 | |
| 212 8060 JONES ROAD | $490,000 | $478,000 | 2.51 | $509,000 | 25-Sep-2020 | 2003 | 14-Oct-2020 | 788 | $621 | |
| 716 5933 COONEY ROAD | $425,000 | $381,800 | 11.31 | $435,000 | 13-Oct-2020 | 2003 | 15-Oct-2020 | 557 | $763 | Renovated/updated. |
| 306 8220 JONES ROAD | $570,000 | $592,000 | -3.72 | $588,888 | 05-Oct-2020 | 1994 | 15-Oct-2020 | 1,029 | $553 | |
| 201 8700 JONES ROAD | $707,000 | $627,000 | 12.76 | $868,900 | 21-Feb-2018 | 1991 | 15-Oct-2020 | 1,764 | $400 | Renovated/updated. |
| 403 8220 JONES ROAD | $450,000 | $442,200 | 1.76 | $469,900 | 24-Sep-2020 | 1994 | 15-Oct-2020 | 727 | $618 | Renovated/updated. |
| 601 9373 HEMLOCK DRIVE | $725,000 | $868,000 | -16.47 | $808,000 | 01-Apr-2019 | 2008 | 15-Oct-2020 | 1,026 | $706 | Renovated/updated. |
| 426 6828 ECKERSLEY ROAD | $495,000 | $508,000 | -2.56 | $508,000 | 28-Jul-2020 | 2011 | 15-Oct-2020 | 786 | $629 | Renovated/updated. |
| 335 9500 ODLIN ROAD | $592,200 | $594,000 | -0.30 | $589,000 | 12-Oct-2020 | 2011 | 15-Oct-2020 | 860 | $688 | Renovated/updated. |
| 803 8333 ANDERSON ROAD | $588,000 | $566,000 | 3.89 | $599,000 | 17-Sep-2020 | 2011 | 15-Oct-2020 | 825 | $712 | |
| 527 9366 TOMICKI AVENUE | $657,000 | $609,000 | 7.88 | $599,000 | 06-Oct-2020 | 2016 | 16-Oct-2020 | 861 | $763 | |
| 105 10631 NO. 3 ROAD | $365,000 | $350,900 | 4.02 | $389,000 | 06-Oct-2020 | 1974 | 16-Oct-2020 | 970 | $376 | Renovated/updated. |
| 1102 6631 MINORU BOULEVARD | $385,000 | $378,400 | 1.74 | $429,900 | 31-Aug-2020 | 1971 | 16-Oct-2020 | 832 | $462 | Renovated/updated. |
| 221 9300 GLENACRES DRIVE | $290,000 | $319,200 | -9.15 | $319,800 | 08-Sep-2020 | 1971 | 17-Oct-2020 | 728 | $398 | |
| 905 5233 GILBERT ROAD | $610,000 | $650,000 | -6.15 | $685,000 | 25-May-2020 | 2016 | 17-Oct-2020 | 774 | $788 | |
| 143 5888 DOVER CRESCENT | $552,000 | $500,000 | 10.40 | $588,000 | 20-May-2020 | 1997 | 17-Oct-2020 | 966 | $571 | |
| 125 9366 TOMICKI AVENUE | $650,000 | $645,000 | 0.78 | $699,900 | 06-Sep-2020 | 2016 | 17-Oct-2020 | 967 | $672 | |
| 422 9388 ODLIN ROAD | $576,000 | $563,500 | 2.22 | $578,000 | 12-Oct-2020 | 2014 | 17-Oct-2020 | 783 | $735 | |
| 205 9320 PARKSVILLE DRIVE | $314,000 | $276,500 | 13.56 | $338,000 | 17-Aug-2020 | 1977 | 17-Oct-2020 | 673 | $466 | |
| 713 5933 COONEY ROAD | $488,000 | $455,600 | 7.11 | $419,800 | 09-Aug-2016 | 2003 | 18-Oct-2020 | 690 | $707 | |
| 1008 7117 ELMBRIDGE WAY | $640,000 | $631,000 | 1.43 | ? | 04-Feb-2011 | 2012 | 19-Oct-2020 | 831 | $770 | |
| 304 8580 GENERAL CURRIE ROAD | $442,000 | $468,000 | -5.56 | $496,900 | 24-Jul-2020 | 1991 | 19-Oct-2020 | 1,053 | $419 | Renovated/updated. |
| 131 5880 DOVER CRESCENT | $417,000 | $419,000 | -0.48 | $399,000 | 07-Oct-2020 | 1995 | 19-Oct-2020 | 674 | $618 | |
| 1202 9188 HEMLOCK DRIVE | $495,000 | $467,000 | 6.00 | $495,000 | 13-Oct-2020 | 2006 | 19-Oct-2020 | 638 | $775 | |
| 409 9399 TOMICKI AVENUE | $557,000 | $586,000 | -4.95 | $568,000 | 15-Sep-2020 | 2011 | 19-Oct-2020 | 835 | $667 | |
| 122 9399 TOMICKI AVENUE | $602,500 | $614,000 | -1.87 | $615,900 | 16-Oct-2020 | 2011 | 20-Oct-2020 | 947 | $636 | Renovated/updated. |
| 225 7531 MINORU BOULEVARD | $370,000 | $317,400 | 16.57 | $349,000 | 14-Oct-2020 | 1983 | 20-Oct-2020 | 673 | $549 | Renovated/updated. |
| 903 3331 BROWN ROAD | $818,000 | $767,000 | 6.65 | $848,000 | 29-Sep-2020 | 2017 | 20-Oct-2020 | 943 | $867 | |
| 519 9399 ALEXANDRA ROAD | $586,000 | $596,000 | -1.68 | $788,800 | 03-Apr-2018 | 2015 | 20-Oct-2020 | 821 | $713 | |
| 419 9333 TOMICKI AVENUE | $725,000 | $747,100 | -2.96 | $888,000 | 11-Sep-2018 | 2014 | 20-Oct-2020 | 1,069 | $678 | |
| 330 8451 WESTMINSTER HIGHWAY | $371,000 | $274,700 | 35.06 | $365,800 | 15-Sep-2020 | 1982 | 20-Oct-2020 | 656 | $565 | Renovated/updated. |
| 423 9500 ODLIN ROAD | $588,000 | $584,000 | 0.68 | $578,000 | 20-Oct-2020 | 2011 | 21-Oct-2020 | 819 | $717 | |
| 316 10033 RIVER DRIVE | $495,000 | $473,000 | 4.65 | $559,000 | 29-Jan-2019 | 2014 | 21-Oct-2020 | 761 | $650 | |
| 305 8677 CAPSTAN WAY | $550,000 | $561,000 | -1.96 | $738,000 | 18-Sep-2018 | 2016 | 21-Oct-2020 | 703 | $782 | |
| 327 8700 ACKROYD ROAD | $315,000 | $296,000 | 6.42 | $327,000 | 05-Oct-2020 | 1981 | 21-Oct-2020 | 717 | $439 | |
| 107 5860 DOVER CRESCENT | $715,000 | $630,000 | 13.49 | $728,000 | 20-Oct-2020 | 1997 | 22-Oct-2020 | 1,229 | $581 | |
| 605 7488 LANSDOWNE ROAD | $738,000 | $676,000 | 9.17 | $799,000 | 14-Sep-2020 | 2017 | 23-Oct-2020 | 837 | $881 | |
| 211 11240 MELLIS DRIVE | $455,000 | $434,000 | 4.84 | $468,800 | 15-Sep-2020 | 1986 | 24-Oct-2020 | 1,303 | $349 | Renovated/updated. |
| 1502 6971 ELMBRIDGE WAY | $680,000 | $670,000 | 1.49 | $729,000 | 08-Oct-2020 | 2014 | 25-Oct-2020 | 805 | $844 | |
| 904 8297 SABA ROAD | $438,000 | $401,000 | 9.23 | $388,000 | 19-Oct-2020 | 1996 | 27-Oct-2020 | 636 | $688 | |
| 101 6611 ECKERSLEY ROAD | $437,000 | $373,000 | 17.16 | $439,900 | 20-Oct-2020 | 2009 | 27-Oct-2020 | 585 | $747 | |
| 413 12339 STEVESTON HIGHWAY | $385,000 | $342,400 | 12.44 | $420,000 | 10-Aug-2020 | 2014 | 30-Oct-2020 | 493 | $780 |
17 out of 51 unrenovated resale homes sold below assessed with a median sold price of 2.51
Burnaby
| Address | Sold Price | Assessed | % Δ | True List Price | True List Date | Year Built | Sold Date | Sqft | Price per sqft | Notes |
|---|---|---|---|---|---|---|---|---|---|---|
| 206 9150 UNIVERSITY HIGH STREET | $482,000 | $481,000 | 0.21 | $489,000 | 01-Oct-2020 | 2012 | 08-Oct-2020 | 868 | $555 | |
| 801 4830 BENNETT STREET | $617,500 | $634,000 | -2.60 | $699,900 | 01-May-2020 | 1992 | 08-Oct-2020 | 1,072 | $576 | |
| 118 4783 DAWSON STREET | $665,000 | $590,000 | 12.71 | $649,900 | 08-Oct-2020 | 2007 | 09-Oct-2020 | 850 | $782 | Renovated/updated. |
| 322 5788 SIDLEY STREET | $450,000 | $441,000 | 2.04 | $459,000 | 07-Oct-2020 | 2012 | 09-Oct-2020 | 623 | $722 | |
| 406 7478 BYRNEPARK WALK | $590,000 | $565,000 | 4.42 | $599,000 | 22-Sep-2020 | 2009 | 09-Oct-2020 | 788 | $748 | |
| 205 1945 WOODWAY PLACE | $405,000 | $444,400 | -8.87 | $459,900 | 09-Sep-2020 | 1978 | 09-Oct-2020 | 947 | $427 | |
| 608 4189 HALIFAX STREET | $635,000 | $582,000 | 9.11 | $699,900 | 22-Apr-2018 | 2015 | 09-Oct-2020 | 769 | $825 | Renovated/updated. |
| 317 5775 IRMIN STREET | $578,000 | $554,000 | 4.33 | ? | 13-Apr-2015 | 2010 | 09-Oct-2020 | 822 | $703 | |
| 1804 6659 SOUTHOAKS CRESCENT | $725,000 | $736,000 | -1.49 | $778,000 | 20-Jun-2019 | 2003 | 09-Oct-2020 | 1,160 | $625 | |
| 502 3399 NOEL DRIVE | $660,000 | $606,000 | 8.91 | $694,900 | 01-Oct-2020 | 2017 | 09-Oct-2020 | 825 | $800 | |
| 1103 6055 NELSON AVENUE | $578,625 | $550,000 | 5.20 | $659,000 | 11-Mar-2020 | 1988 | 09-Oct-2020 | 1,071 | $540 | Renovated/updated. |
| 201 6070 MCMURRAY AVENUE | $428,000 | $399,000 | 7.27 | $458,000 | 24-Aug-2020 | 1987 | 10-Oct-2020 | 810 | $528 | Renovated/updated. |
| 705 6622 SOUTHOAKS CRESCENT | $540,000 | $478,000 | 12.97 | $588,000 | 15-Sep-2020 | 1997 | 10-Oct-2020 | 857 | $630 | |
| 2205 4688 KINGSWAY | $515,000 | $460,000 | 11.96 | $535,000 | 15-Aug-2019 | 2015 | 10-Oct-2020 | 476 | $1,081 | |
| 402 5211 GRIMMER STREET | $469,000 | $411,900 | 13.86 | $479,800 | 05-Oct-2020 | 2009 | 10-Oct-2020 | 638 | $735 | |
| 801 6638 DUNBLANE AVENUE | $750,000 | $719,000 | 4.31 | $788,000 | 01-Oct-2020 | 2018 | 11-Oct-2020 | 907 | $826 | |
| 1303 5833 WILSON AVENUE | $645,000 | $684,000 | -5.70 | $742,000 | 06-Jul-2020 | 1994 | 11-Oct-2020 | 1,072 | $601 | |
| 3502 5883 BARKER AVENUE | $780,000 | $707,000 | 10.33 | $799,000 | 24-Aug-2020 | 2017 | 11-Oct-2020 | 765 | $1,019 | Renovated/updated. |
| 504 9339 UNIVERSITY CRESCENT | $606,000 | $606,000 | 0.00 | $599,900 | 05-Oct-2020 | 2004 | 11-Oct-2020 | 1,209 | $501 | |
| 112 3921 CARRIGAN COURT | $329,000 | $316,600 | 3.92 | $358,000 | 15-Jun-2020 | 1972 | 11-Oct-2020 | 677 | $485 | Renovated/updated. |
| 805 7088 SALISBURY AVENUE | $625,000 | $524,000 | 19.27 | $615,000 | 09-Oct-2020 | 2008 | 11-Oct-2020 | 889 | $703 | |
| 2107 9280 SALISH COURT | $405,000 | $389,000 | 4.11 | $419,900 | 02-Sep-2020 | 1977 | 11-Oct-2020 | 825 | $490 | Renovated/updated. |
| 1501 3771 BARTLETT COURT | $445,000 | $418,000 | 6.46 | $479,888 | 08-Sep-2020 | 1976 | 11-Oct-2020 | 930 | $478 | Renovated/updated. |
| 408 4307 HASTINGS STREET | $920,000 | $781,000 | 17.80 | $924,900 | 05-Oct-2020 | 2015 | 11-Oct-2020 | 1,045 | $880 | Renovated/updated. |
| 2933 ARGO PLACE | $390,000 | $398,600 | -2.16 | $418,000 | 09-Sep-2020 | 1975 | 11-Oct-2020 | 913 | $427 | |
| 1101 7321 HALIFAX STREET | $535,000 | $504,000 | 6.15 | $558,800 | 15-Sep-2020 | 1987 | 11-Oct-2020 | 1,018 | $525 | Renovated/updated. |
| 1402 5652 PATTERSON AVENUE | $480,000 | $465,000 | 3.23 | $499,000 | 06-Oct-2020 | 1981 | 11-Oct-2020 | 989 | $485 | Renovated/updated. |
| 301 7139 18TH AVENUE | $450,000 | $463,900 | -3.00 | $430,000 | 06-Oct-2020 | 1994 | 11-Oct-2020 | 839 | $536 | Renovated/updated. |
| 601 9025 HIGHLAND COURT | $310,000 | $349,000 | -11.17 | $325,000 | 08-Oct-2020 | 2013 | 12-Oct-2020 | 402 | $771 | |
| 2602 4485 SKYLINE DRIVE | $570,800 | $500,000 | 14.16 | $569,900 | 05-Oct-2020 | 2017 | 12-Oct-2020 | 519 | $1,099 | |
| 2402 4508 HAZEL STREET | $420,000 | $380,000 | 10.53 | $428,000 | 19-Jun-2017 | 2015 | 12-Oct-2020 | 400 | $1,050 | |
| 113 9202 HORNE STREET | $410,000 | $395,300 | 3.72 | $449,888 | 18-Sep-2020 | 1974 | 12-Oct-2020 | 936 | $438 | Renovated/updated. |
| 3107 4900 LENNOX LANE | $738,000 | $751,000 | -1.73 | $826,000 | 08-Jul-2020 | 2017 | 12-Oct-2020 | 755 | $977 | |
| 2605 2378 ALPHA AVENUE | $800,000 | $868,000 | -7.83 | $808,000 | 16-Sep-2020 | 2018 | 13-Oct-2020 | 842 | $950 | |
| 3710 4670 ASSEMBLY WAY | $888,000 | $892,000 | -0.45 | $969,000 | 07-Jul-2020 | 2018 | 13-Oct-2020 | 887 | $1,001 | |
| 1008 4300 MAYBERRY STREET | $461,000 | $423,500 | 8.85 | $499,999 | 11-May-2018 | 1976 | 13-Oct-2020 | 878 | $525 | Renovated/updated. |
| 311 6888 ROYAL OAK AVENUE | $572,000 | $571,500 | 0.09 | $608,000 | 10-Aug-2020 | 2012 | 13-Oct-2020 | 849 | $673 | |
| 503 7488 BYRNEPARK WALK | $730,000 | $692,000 | 5.49 | $699,000 | 05-Oct-2020 | 2009 | 13-Oct-2020 | 950 | $768 | |
| 706 6540 BURLINGTON AVENUE | $505,000 | $514,000 | -1.75 | $539,000 | 25-Jul-2019 | 1983 | 13-Oct-2020 | 1,067 | $473 | Renovated/updated. |
| 103 5248 GRIMMER STREET | $580,000 | $511,000 | 13.50 | $499,000 | 07-Oct-2020 | 2012 | 13-Oct-2020 | 782 | $741 | |
| 214 1955 WOODWAY PLACE | $445,000 | $465,300 | -4.36 | $449,000 | 09-Oct-2020 | 1978 | 13-Oct-2020 | 1,004 | $443 | Renovated/updated. |
| 400 4825 HAZEL STREET | $607,000 | $631,000 | -3.80 | $649,000 | 10-Aug-2020 | 1990 | 13-Oct-2020 | 1,171 | $518 | Renovated/updated. |
| 700 9300 UNIVERSITY CRESCENT | $672,000 | $680,000 | -1.18 | $715,000 | 23-Jul-2020 | 2004 | 13-Oct-2020 | 1,182 | $568 | |
| 1201 5051 IMPERIAL STREET | $602,500 | $586,000 | 2.82 | $679,990 | 25-May-2020 | 2019 | 13-Oct-2020 | 631 | $954 | |
| 809 6538 NELSON AVENUE | $708,000 | $682,000 | 3.81 | $749,000 | 06-Aug-2020 | 2017 | 13-Oct-2020 | 763 | $927 | |
| 110 5889 IRMIN STREET | $547,000 | $529,000 | 3.40 | ? | 19-Jan-2015 | 2009 | 14-Oct-2020 | 803 | $681 | |
| 122 3399 NOEL DRIVE | $657,000 | $612,000 | 7.35 | $689,000 | 14-Sep-2020 | 2017 | 14-Oct-2020 | 860 | $763 | |
| 1101 9633 MANCHESTER DRIVE | $385,000 | $388,000 | -0.77 | $428,000 | 29-Sep-2020 | 1993 | 14-Oct-2020 | 668 | $576 | |
| 1603 4132 HALIFAX STREET | $680,000 | $640,000 | 6.25 | $699,000 | 01-Sep-2020 | 2005 | 15-Oct-2020 | 942 | $721 | |
| 2403 4398 BUCHANAN STREET | $1,075,000 | $1,044,000 | 2.97 | $1,150,000 | 14-Sep-2020 | 2000 | 15-Oct-2020 | 1,671 | $643 | Renovated/updated. |
| 502 6737 STATION HILL COURT | $408,000 | $414,700 | -1.62 | $408,000 | 13-Oct-2020 | 1991 | 15-Oct-2020 | 759 | $537 | Renovated/updated. |
| 402 7108 EDMONDS STREET | $519,000 | $519,000 | 0.00 | $578,000 | 30-Jul-2020 | 1992 | 15-Oct-2020 | 992 | $523 | |
| 1503 7090 EDMONDS STREET | $677,000 | $653,000 | 3.68 | $788,800 | 13-Apr-2020 | 2011 | 16-Oct-2020 | 904 | $748 | |
| 1506 5645 BARKER AVENUE | $475,000 | $491,000 | -3.26 | $499,900 | 28-Jul-2020 | 1974 | 16-Oct-2020 | 931 | $510 | |
| 3107 6333 SILVER AVENUE | $800,000 | $799,000 | 0.13 | $845,000 | 01-Aug-2019 | 2015 | 17-Oct-2020 | 885 | $903 | |
| 2108 3970 CARRIGAN COURT | $489,000 | $492,000 | -0.61 | $508,800 | 13-Aug-2020 | 1987 | 17-Oct-2020 | 886 | $551 | |
| 601 5899 WILSON AVENUE | $685,000 | $620,000 | 10.48 | $718,000 | 13-Aug-2020 | 1995 | 18-Oct-2020 | 1,199 | $571 | Renovated/updated. |
| 301 7418 BYRNEPARK WALK | $475,000 | $453,000 | 4.86 | $497,000 | 20-Jul-2020 | 2010 | 18-Oct-2020 | 618 | $768 | |
| 3105 2388 MADISON AVENUE | $696,000 | $769,000 | -9.49 | $749,900 | 13-Mar-2020 | 2019 | 18-Oct-2020 | 761 | $914 | Brand New. |
| 2210 7303 NOBLE LANE | $753,300 | $741,000 | 1.66 | $799,900 | 08-Sep-2020 | 2019 | 19-Oct-2020 | 855 | $881 | Renovated/updated. |
| 103 9890 MANCHESTER DRIVE | $420,000 | $418,100 | 0.45 | $440,000 | 03-Sep-2020 | 1981 | 19-Oct-2020 | 910 | $461 | Renovated/updated. |
| 1601 7178 COLLIER STREET | $468,000 | $466,000 | 0.43 | $485,000 | 28-Aug-2020 | 2005 | 19-Oct-2020 | 635 | $737 | |
| 109 2088 BETA AVENUE | $652,500 | $620,000 | 5.24 | $688,000 | 03-Sep-2020 | 2009 | 19-Oct-2020 | 928 | $703 | |
| 316 7131 STRIDE AVENUE | $498,000 | $492,000 | 1.22 | $499,900 | 05-Oct-2020 | 2013 | 19-Oct-2020 | 673 | $739 | Renovated/updated. |
| 209 9233 GOVERNMENT STREET | $542,500 | $532,000 | 1.97 | $569,900 | 28-Sep-2020 | 2007 | 19-Oct-2020 | 895 | $606 | |
| 204 5674 JERSEY AVENUE | $499,500 | $490,000 | 1.94 | $529,900 | 27-Jul-2020 | 1989 | 19-Oct-2020 | 968 | $516 | Renovated/updated. |
| 2101 9888 CAMERON STREET | $483,000 | $488,000 | -1.02 | $499,900 | 30-Sep-2020 | 2008 | 19-Oct-2020 | 630 | $766 | |
| 3001 4485 SKYLINE DRIVE | $840,000 | $828,000 | 1.45 | $928,000 | 16-Sep-2020 | 2017 | 19-Oct-2020 | 931 | $902 | |
| 1302 6461 TELFORD AVENUE | $748,000 | $748,000 | 0.00 | $765,000 | 22-Jun-2020 | 2011 | 19-Oct-2020 | 890 | $840 | |
| 301 6860 RUMBLE STREET | $395,000 | $357,600 | 10.46 | $435,000 | 28-Aug-2020 | 1992 | 20-Oct-2020 | 712 | $554 | |
| 311 3883 LAUREL STREET | $310,000 | $267,200 | 16.02 | ? | 01-Feb-2012 | 1983 | 20-Oct-2020 | 680 | $455 | |
| 205 9603 MANCHESTER DRIVE | $610,000 | $596,000 | 2.35 | ? | 18-Jul-2012 | 1993 | 20-Oct-2020 | 1,142 | $534 | Renovated/updated. |
| 201 6168 WILSON AVENUE | $850,000 | $858,000 | -0.93 | $899,999 | 16-Sep-2020 | 2012 | 20-Oct-2020 | 1,155 | $735 | |
| 1001 4880 BENNETT STREET | $690,000 | $600,000 | 15.00 | $790,000 | 30-Jul-2019 | 2013 | 20-Oct-2020 | 812 | $849 | |
| 1505 1788 GILMORE AVENUE | $814,020 | $749,000 | 8.68 | $890,000 | 29-Jul-2020 | 2019 | 20-Oct-2020 | 942 | $864 | |
| 2502 2225 HOLDOM AVENUE | $583,500 | $581,000 | 0.43 | $599,900 | 13-Oct-2020 | 2007 | 21-Oct-2020 | 867 | $673 | |
| 1205 4888 BRENTWOOD DRIVE | $505,000 | $484,000 | 4.34 | $519,900 | 16-Oct-2020 | 2008 | 21-Oct-2020 | 699 | $722 | |
| 401 3971 HASTINGS STREET | $899,900 | $856,000 | 5.13 | $899,900 | 12-Mar-2020 | 2019 | 21-Oct-2020 | 1,008 | $892 | |
| 1007 9060 UNIVERSITY CRESCENT | $550,000 | $640,000 | -14.06 | $599,000 | 07-Aug-2020 | 2015 | 21-Oct-2020 | 802 | $685 | |
| 2209 6658 DOW AVENUE | $799,888 | $778,000 | 2.81 | $828,000 | 29-Sep-2020 | 2013 | 21-Oct-2020 | 895 | $893 | |
| 2910 6538 NELSON AVENUE | $775,000 | $753,000 | 2.92 | $798,000 | 19-Oct-2020 | 2017 | 21-Oct-2020 | 756 | $1,025 | |
| 21B 6128 PATTERSON AVENUE | $643,000 | $609,000 | 5.58 | $848,000 | 18-Jul-2018 | 1992 | 22-Oct-2020 | 1,028 | $625 | |
| 107 7180 LINDEN AVENUE | $295,000 | $283,400 | 4.09 | $299,800 | 01-Oct-2020 | 1973 | 22-Oct-2020 | 733 | $402 | Renovated/updated. |
| 27 7179 18TH AVENUE | $590,000 | $569,000 | 3.69 | $599,900 | 14-Oct-2020 | 1997 | 22-Oct-2020 | 1,024 | $576 | |
| 309 7777 ROYAL OAK AVENUE | $463,500 | $443,000 | 4.63 | $509,000 | 01-May-2018 | 2012 | 22-Oct-2020 | 626 | $740 | |
| 203 9151 SATURNA DRIVE | $399,000 | $368,000 | 8.42 | $399,000 | 30-Sep-2020 | 1976 | 22-Oct-2020 | 830 | $480 | Renovated/updated. |
| 2206 2388 MADISON AVENUE | $740,000 | $795,000 | -6.92 | $800,000 | 18-Feb-2020 | 2019 | 22-Oct-2020 | 799 | $926 | Brand New. |
| 1908 6333 SILVER AVENUE | $690,000 | $645,000 | 6.98 | $699,999 | 16-Oct-2020 | 2015 | 23-Oct-2020 | 732 | $942 | |
| 1809 4670 ASSEMBLY WAY | $625,000 | $546,000 | 14.47 | $599,999 | 15-Oct-2020 | 2018 | 23-Oct-2020 | 604 | $1,034 | |
| 908 4900 LENNOX LANE | $719,000 | $668,000 | 7.63 | $765,000 | 01-Apr-2019 | 2017 | 25-Oct-2020 | 755 | $952 | |
| 1108 3760 ALBERT STREET | $567,500 | $522,000 | 8.72 | $579,000 | 21-Oct-2020 | 1983 | 25-Oct-2020 | 954 | $594 | Renovated/updated. |
| 1502 9595 ERICKSON DRIVE | $365,000 | $352,000 | 3.69 | $379,000 | 13-Jul-2020 | 1981 | 25-Oct-2020 | 743 | $491 | Renovated/updated. |
| 401 7908 15TH AVENUE | $610,000 | $538,000 | 13.38 | $698,000 | 05-Oct-2020 | 2018 | 26-Oct-2020 | 835 | $730 | Renovated/updated. |
| 411 9890 MANCHESTER DRIVE | $378,000 | $404,400 | -6.53 | $375,000 | 20-Oct-2020 | 1981 | 26-Oct-2020 | 890 | $424 | Renovated/updated. |
| 111 3388 MORREY COURT | $459,800 | $421,000 | 9.22 | $459,800 | 19-Oct-2020 | 2005 | 26-Oct-2020 | 728 | $631 | Renovated/updated. |
| 2706 2008 ROSSER AVENUE | $590,000 | $570,000 | 3.51 | $650,000 | 26-Feb-2019 | 2015 | 26-Oct-2020 | 593 | $994 | |
| 400 6707 SOUTHPOINT DRIVE | $565,000 | $553,000 | 2.17 | $599,999 | 25-Aug-2020 | 1989 | 26-Oct-2020 | 1,041 | $542 | Renovated/updated. |
| 1602 4425 HALIFAX STREET | $808,000 | $764,000 | 5.76 | $825,000 | 30-Sep-2020 | 1998 | 30-Oct-2020 | 1,135 | $711 |
16 out of 57 unrenovated resale homes sold below assessed with a median sold price of 3.68
West Vancouver
| Address | Sold Price | Assessed | % Δ | True List Price | True List Date | Year Built | Sold Date | Sqft | Price per sqft | Notes |
|---|---|---|---|---|---|---|---|---|---|---|
| 503 2165 ARGYLE AVENUE | $1,280,000 | $1,087,000 | 17.76 | $1,289,000 | 06-Oct-2020 | 1974 | 08-Oct-2020 | 1,262 | $1,014 | Renovated/updated. |
| 301 2471 BELLEVUE AVENUE | $2,105,000 | $2,135,000 | -1.41 | $2,799,000 | 08-Sep-2020 | 1984 | 11-Oct-2020 | 2,003 | $1,050 | |
| 1103 3355 CYPRESS PLACE | $1,950,000 | $1,947,000 | 0.15 | $2,278,000 | 26-Mar-2019 | 2004 | 11-Oct-2020 | 2,014 | $968 | |
| 802 2165 ARGYLE AVENUE | $2,198,000 | $1,642,000 | 33.86 | $2,198,000 | 28-Sep-2020 | 1974 | 12-Oct-2020 | 1,507 | $1,458 | Renovated/updated. |
| 302 2090 ARGYLE AVENUE | $1,570,000 | $1,732,000 | -9.35 | $1,699,000 | 30-Jul-2020 | 1975 | 14-Oct-2020 | 1,292 | $1,215 | Renovated/updated. |
| 402 2246 BELLEVUE AVENUE | $1,250,000 | $1,322,900 | -5.51 | $1,650,000 | 30-May-2019 | 1968 | 15-Oct-2020 | 1,073 | $1,164 | Renovated/updated. |
| 402 3355 CYPRESS PLACE | $1,499,000 | $1,405,000 | 6.69 | $1,499,000 | 08-Oct-2020 | 2004 | 18-Oct-2020 | 1,571 | $954 | |
| 503 2135 ARGYLE AVENUE | $700,000 | $734,600 | -4.71 | $759,000 | 02-Sep-2020 | 1961 | 20-Oct-2020 | 813 | $861 | |
| 4 2130 MARINE DRIVE | $620,000 | $603,000 | 2.82 | $649,000 | 14-Sep-2020 | 1988 | 21-Oct-2020 | 891 | $695 | Renovated/updated. |
| 600 888 ARTHUR ERICKSON PLACE | $1,080,000 | $1,236,000 | -12.62 | $1,366,000 | 22-May-2019 | 2015 | 22-Oct-2020 | 981 | $1,100 | |
| 405 150 24TH STREET | $1,640,000 | $1,730,000 | -5.20 | $1,550,000 | 22-Oct-2020 | 1963 | 27-Oct-2020 | 1,304 | $1,257 |
4 out of 6 unrenovated resale homes sold below assessed with a median sold price of -3.06
New Westminster
| Address | Sold Price | Assessed | % Δ | True List Price | True List Date | Year Built | Sold Date | Sqft | Price per sqft | Notes |
|---|---|---|---|---|---|---|---|---|---|---|
| 907 612 SIXTH STREET | $630,000 | $571,000 | 10.33 | $598,900 | 05-Oct-2020 | 1999 | 08-Oct-2020 | 1,226 | $513 | Renovated/updated. |
| 508 14 BEGBIE STREET | $625,000 | $614,000 | 1.79 | $649,000 | 27-Jul-2020 | 2009 | 08-Oct-2020 | 1,010 | $618 | |
| 2010 908 QUAYSIDE DRIVE | $489,000 | $418,000 | 16.99 | $449,900 | 01-Oct-2020 | 2019 | 08-Oct-2020 | 524 | $933 | |
| 1606 1135 QUAYSIDE DRIVE | $750,000 | $756,000 | -0.79 | $749,900 | 05-Oct-2020 | 1989 | 09-Oct-2020 | 1,436 | $522 | Renovated/updated. |
| 1003 420 CARNARVON STREET | $645,000 | $606,000 | 6.44 | $699,900 | 01-Sep-2020 | 1990 | 09-Oct-2020 | 1,405 | $459 | Renovated/updated. |
| 2501 908 QUAYSIDE DRIVE | $516,000 | $466,000 | 10.73 | $546,900 | 26-Aug-2020 | 2019 | 09-Oct-2020 | 562 | $918 | |
| 511 608 BELMONT STREET | $490,000 | $476,000 | 2.94 | $529,000 | 01-Oct-2020 | 2011 | 09-Oct-2020 | 742 | $660 | |
| 403 262 SALTER STREET | $665,000 | $577,000 | 15.25 | $675,000 | 30-Sep-2020 | 2015 | 09-Oct-2020 | 1,061 | $626 | |
| 104 707 HAMILTON STREET | $396,000 | $367,400 | 7.78 | $399,900 | 06-Oct-2020 | 1976 | 09-Oct-2020 | 940 | $421 | Renovated/updated. |
| 1106 988 QUAYSIDE DRIVE | $470,000 | $410,000 | 14.63 | $474,800 | 08-Sep-2020 | 2019 | 10-Oct-2020 | 554 | $848 | |
| 805 668 COLUMBIA STREET | $495,000 | $431,000 | 14.85 | $499,000 | 30-Sep-2020 | 2015 | 11-Oct-2020 | 585 | $846 | |
| 209 14 E ROYAL AVENUE | $525,000 | $495,000 | 6.06 | $550,000 | 09-Apr-2019 | 2005 | 12-Oct-2020 | 903 | $581 | |
| 1104 668 COLUMBIA STREET | $445,000 | $375,000 | 18.67 | $448,000 | 30-Sep-2020 | 2015 | 12-Oct-2020 | 513 | $867 | |
| 202 220 SALTER STREET | $620,250 | $582,000 | 6.57 | $628,000 | 26-May-2020 | 2013 | 12-Oct-2020 | 970 | $639 | |
| 317 22 E ROYAL AVENUE | $580,000 | $597,000 | -2.85 | $579,900 | 06-Oct-2020 | 2016 | 13-Oct-2020 | 969 | $598 | |
| 1001 1026 QUEENS AVENUE | $473,000 | $459,000 | 3.05 | $479,000 | 12-Aug-2020 | 1984 | 13-Oct-2020 | 1,069 | $442 | Renovated/updated. |
| 214 7 RIALTO COURT | $520,000 | $456,000 | 14.04 | $538,000 | 22-Jun-2020 | 2005 | 14-Oct-2020 | 785 | $662 | Renovated/updated. |
| 209 515 ELEVENTH STREET | $325,000 | $274,100 | 18.57 | $329,900 | 06-Oct-2020 | 1974 | 14-Oct-2020 | 679 | $478 | Renovated/updated. |
| 106 3 K DE K COURT | $550,000 | $576,000 | -4.51 | $570,000 | 08-Oct-2020 | 1986 | 14-Oct-2020 | 1,066 | $515 | |
| 1002 739 PRINCESS STREET | $530,000 | $545,000 | -2.75 | $574,900 | 17-Aug-2020 | 1996 | 14-Oct-2020 | 1,090 | $486 | |
| 404 509 CARNARVON STREET | $407,900 | $395,800 | 3.06 | $409,900 | 12-Oct-2020 | 1993 | 15-Oct-2020 | 731 | $558 | Renovated/updated. |
| 107 808 SANGSTER PLACE | $598,000 | $525,000 | 13.90 | $599,900 | 29-Sep-2020 | 2004 | 15-Oct-2020 | 1,108 | $539 | Renovated/updated. |
| 3005 892 CARNARVON STREET | $539,000 | $508,000 | 6.10 | $549,000 | 21-Sep-2020 | 2009 | 15-Oct-2020 | 788 | $684 | |
| 1201 210 SALTER STREET | $809,000 | $907,000 | -10.80 | $869,000 | 11-Aug-2020 | 2017 | 15-Oct-2020 | 1,265 | $639 | |
| 203 1306 FIFTH AVENUE | $519,000 | $553,000 | -6.15 | $599,900 | 24-Jul-2019 | 2018 | 16-Oct-2020 | 825 | $629 | |
| 207 135 ELEVENTH STREET | $487,000 | $397,000 | 22.67 | $499,000 | 18-Sep-2020 | 1994 | 16-Oct-2020 | 750 | $649 | Renovated/updated. |
| 602 420 CARNARVON STREET | $549,500 | $574,000 | -4.27 | $549,000 | 13-Oct-2020 | 1990 | 17-Oct-2020 | 1,198 | $458 | |
| 406 275 ROSS DRIVE | $492,500 | $477,000 | 3.25 | $500,000 | 13-Oct-2020 | 2008 | 17-Oct-2020 | 833 | $591 | Renovated/updated. |
| 102 225 MOWAT STREET | $362,500 | $324,300 | 11.78 | $365,000 | 06-Oct-2020 | 1983 | 17-Oct-2020 | 685 | $529 | Renovated/updated. |
| 408 808 SANGSTER PLACE | $470,000 | $424,000 | 10.85 | $478,000 | 05-Oct-2020 | 2004 | 17-Oct-2020 | 822 | $571 | Renovated/updated. |
| 1103 410 CARNARVON STREET | $635,000 | $642,000 | -1.09 | $668,900 | 28-Sep-2020 | 1990 | 18-Oct-2020 | 1,390 | $456 | Renovated/updated. |
| 304 83 STAR CRESCENT | $450,000 | $506,000 | -11.07 | $474,000 | 08-Apr-2019 | 1998 | 18-Oct-2020 | 938 | $479 | Renovated/updated. |
| 414 262 SALTER STREET | $754,000 | $704,000 | 7.10 | $759,000 | 06-Oct-2020 | 2015 | 18-Oct-2020 | 1,387 | $543 | |
| 108 262 SALTER STREET | $609,350 | $498,000 | 22.36 | $615,000 | 15-Oct-2020 | 2015 | 19-Oct-2020 | 926 | $658 | |
| 401 7 RIALTO COURT | $605,000 | $560,000 | 8.04 | $619,900 | 28-Sep-2020 | 2005 | 19-Oct-2020 | 1,008 | $600 | |
| 302 110 SEVENTH STREET | $421,000 | $379,300 | 10.99 | $429,900 | 02-Sep-2020 | 1977 | 20-Oct-2020 | 927 | $454 | Renovated/updated. |
| 1001 98 TENTH STREET | $585,000 | $603,000 | -2.99 | $625,000 | 17-Jun-2020 | 1991 | 21-Oct-2020 | 1,455 | $402 | |
| 501 210 SALTER STREET | $560,000 | $614,000 | -8.79 | $599,000 | 07-Aug-2020 | 2017 | 22-Oct-2020 | 859 | $651 | |
| 404 209 CARNARVON STREET | $388,000 | $405,000 | -4.20 | $368,800 | 13-Oct-2020 | 1976 | 22-Oct-2020 | 908 | $427 | Renovated/updated. |
| 209 18 SMOKEY SMITH PLACE | $540,000 | $463,000 | 16.63 | $545,000 | 19-Oct-2020 | 2000 | 23-Oct-2020 | 877 | $615 | Renovated/updated. |
| 101 26 E ROYAL AVENUE | $750,000 | $709,000 | 5.78 | $849,000 | 30-Jul-2020 | 2018 | 24-Oct-2020 | 1,123 | $667 | |
| 203 98 TENTH STREET | $500,000 | $501,000 | -0.20 | $559,900 | 09-Oct-2020 | 1991 | 24-Oct-2020 | 1,243 | $402 | |
| 205 420 CARNARVON STREET | $570,000 | $566,000 | 0.71 | $569,900 | 19-Oct-2020 | 1990 | 25-Oct-2020 | 1,152 | $494 | Renovated/updated. |
| 303 610 VICTORIA STREET | $482,000 | $408,000 | 18.14 | $517,000 | 23-Sep-2020 | 2007 | 25-Oct-2020 | 630 | $765 | |
| 401 509 CARNARVON STREET | $459,000 | $478,000 | -3.97 | $459,000 | 23-Oct-2020 | 1993 | 25-Oct-2020 | 923 | $497 | Renovated/updated. |
| 405 410 AGNES STREET | $355,000 | $332,200 | 6.86 | $379,000 | 05-Oct-2020 | 1975 | 26-Oct-2020 | 714 | $497 | Renovated/updated. |
| 308 737 HAMILTON STREET | $543,000 | $489,900 | 10.84 | $549,900 | 20-Oct-2020 | 1984 | 26-Oct-2020 | 1,125 | $482 | Renovated/updated. |
| 211 611 BLACKFORD STREET | $290,000 | $246,800 | 17.50 | $299,900 | 02-Nov-2020 | 1964 | 02-Nov-2020 | 555 | $522 |
9 out of 23 unrenovated resale homes sold below assessed with a median sold price of 5.78
North Vancouver
| Address | Sold Price | Assessed | % Δ | True List Price | True List Date | Year Built | Sold Date | Sqft | Price per sqft | Notes |
|---|---|---|---|---|---|---|---|---|---|---|
| 205 960 LYNN VALLEY ROAD | $442,500 | $447,000 | -1.01 | $449,000 | 28-Sep-2020 | 2002 | 08-Oct-2020 | 750 | $590 | |
| 606 118 CARRIE CATES COURT | $1,050,000 | $616,500 | 70.32 | $1,190,000 | 16-Mar-2020 | 2019 | 08-Oct-2020 | 815 | $1,288 | Brand New. |
| 603 112 E 13TH STREET | $830,000 | $851,000 | -2.47 | $899,000 | 03-Mar-2020 | 2017 | 09-Oct-2020 | 942 | $881 | |
| 314 155 E 3RD STREET | $515,000 | $479,000 | 7.52 | $589,000 | 17-May-2018 | 1997 | 09-Oct-2020 | 662 | $777 | |
| 307 1085 W 17TH STREET | $590,000 | $512,000 | 15.23 | $619,000 | 20-Aug-2020 | 1996 | 10-Oct-2020 | 825 | $715 | Renovated/updated. |
| 603 168 CHADWICK COURT | $1,180,000 | $1,047,000 | 12.70 | $1,298,000 | 26-May-2020 | 1990 | 10-Oct-2020 | 1,278 | $923 | Renovated/updated. |
| 702 175 VICTORY SHIP WAY | $717,000 | $747,000 | -4.02 | $928,000 | 19-Feb-2019 | 2018 | 10-Oct-2020 | 632 | $1,134 | |
| 123 723 W 3RD STREET | $774,500 | $674,000 | 14.91 | $788,000 | 06-Oct-2020 | 2015 | 10-Oct-2020 | 804 | $963 | |
| 201 1111 LYNN VALLEY ROAD | $503,000 | $450,000 | 11.78 | $509,000 | 07-Oct-2020 | 2000 | 10-Oct-2020 | 677 | $742 | |
| 205 150 W 22ND STREET | $615,000 | $485,000 | 26.80 | $599,000 | 05-Oct-2020 | 1997 | 10-Oct-2020 | 778 | $790 | Renovated/updated. |
| 303 1140 STRATHAVEN DRIVE | $810,000 | $809,000 | 0.12 | ? | 12-Nov-2010 | 1995 | 11-Oct-2020 | 1,355 | $597 | Renovated/updated. |
| 302 141 W 13TH STREET | $414,000 | $350,200 | 18.22 | $419,900 | 08-Oct-2020 | 1975 | 11-Oct-2020 | 716 | $578 | Renovated/updated. |
| 805 160 W KEITH ROAD | $720,000 | $730,000 | -1.37 | $748,800 | 10-Sep-2020 | 1996 | 12-Oct-2020 | 854 | $843 | |
| 301 3825 CATES LANDING WAY | $975,000 | $1,098,000 | -11.20 | $0 | 21-Sep-2015 | 2017 | 12-Oct-2020 | 1,130 | $862 | |
| 410 131 E 3RD STREET | $579,000 | $596,000 | -2.85 | $588,000 | 06-Oct-2020 | 2016 | 12-Oct-2020 | 630 | $919 | |
| 208 240 MAHON AVENUE | $535,000 | $451,500 | 18.49 | $549,000 | 14-Sep-2020 | 1980 | 13-Oct-2020 | 810 | $660 | |
| 203 1182 W 16TH STREET | $780,000 | $674,000 | 15.73 | $799,000 | 17-Sep-2020 | 2013 | 14-Oct-2020 | 908 | $859 | |
| 612 123 W 1ST STREET | $1,295,000 | $1,378,000 | -6.02 | $1,450,000 | 18-May-2020 | 2016 | 14-Oct-2020 | 1,220 | $1,061 | |
| 704 124 W 1ST STREET | $630,000 | $563,000 | 11.90 | $629,000 | 22-Sep-2020 | 2002 | 15-Oct-2020 | 632 | $996 | |
| 807 1515 EASTERN AVENUE | $482,000 | $413,000 | 16.71 | $499,900 | 06-Oct-2020 | 1982 | 15-Oct-2020 | 688 | $700 | Renovated/updated. |
| 310 1000 BOWRON COURT | $725,000 | $599,000 | 21.04 | $778,000 | 17-Jul-2020 | 1987 | 16-Oct-2020 | 1,281 | $565 | Renovated/updated. |
| 306 3191 MOUNTAIN HIGHWAY | $642,500 | $524,800 | 22.43 | $679,000 | 05-Oct-2020 | 1986 | 16-Oct-2020 | 1,045 | $614 | Renovated/updated. |
| 102 855 W 16TH STREET | $625,000 | $597,000 | 4.69 | $649,900 | 08-Sep-2020 | 1994 | 17-Oct-2020 | 900 | $694 | Renovated/updated. |
| 109 255 W 1ST STREET | $1,020,000 | $918,000 | 11.11 | $1,024,800 | 14-Oct-2020 | 2017 | 17-Oct-2020 | 1,063 | $959 | |
| 307 127 E 4TH STREET | $665,000 | $606,000 | 9.74 | $725,000 | 07-Aug-2020 | 1972 | 17-Oct-2020 | 997 | $667 | Renovated/updated. |
| 301 408 LONSDALE AVENUE | $753,000 | $730,000 | 3.15 | $799,000 | 20-Apr-2019 | 1989 | 17-Oct-2020 | 1,008 | $747 | Renovated/updated. |
| 503 555 W 28TH STREET | $520,000 | $480,600 | 8.20 | $578,000 | 25-Jan-2019 | 1968 | 18-Oct-2020 | 924 | $562 | Renovated/updated. |
| 311 177 W 3RD STREET | $1,234,900 | $1,039,000 | 18.85 | $1,289,900 | 22-Jul-2020 | 2019 | 18-Oct-2020 | 1,238 | $997 | |
| 2003 2016 FULLERTON AVENUE | $355,000 | $334,600 | 6.10 | $348,000 | 08-Sep-2020 | 1972 | 18-Oct-2020 | 534 | $664 | Renovated/updated. |
| 303 111 E 3RD STREET | $600,000 | $648,000 | -7.41 | $639,000 | 08-Jun-2020 | 2013 | 18-Oct-2020 | 663 | $904 | |
| 1001 125 E 14TH STREET | $592,000 | $580,000 | 2.07 | $635,000 | 08-Jul-2019 | 2017 | 19-Oct-2020 | 575 | $1,029 | |
| 1310 2020 FULLERTON AVENUE | $550,000 | $536,600 | 2.50 | $599,500 | 01-Oct-2020 | 1975 | 19-Oct-2020 | 908 | $605 | Renovated/updated. |
| 102 333 W 4TH STREET | $490,000 | $475,000 | 3.16 | $498,000 | 13-Oct-2020 | 1987 | 19-Oct-2020 | 773 | $633 | |
| 4 369 W 4TH STREET | $398,800 | $388,900 | 2.55 | $398,800 | 13-Oct-2020 | 1972 | 20-Oct-2020 | 750 | $531 | Renovated/updated. |
| 608 719 W 3RD STREET | $824,000 | $810,000 | 1.73 | $835,000 | 30-Sep-2020 | 2017 | 20-Oct-2020 | 882 | $934 | Renovated/updated. |
| 307 935 W 16TH STREET | $605,000 | $634,000 | -4.57 | $679,500 | 23-May-2018 | 2009 | 20-Oct-2020 | 884 | $684 | |
| 110 341 W 3RD STREET | $591,000 | $571,000 | 3.50 | $685,000 | 26-Sep-2018 | 1975 | 21-Oct-2020 | 946 | $624 | Renovated/updated. |
| 410 168 CHADWICK COURT | $912,500 | $961,000 | -5.05 | $968,000 | 13-Oct-2020 | 1990 | 21-Oct-2020 | 1,057 | $863 | |
| 201 960 LYNN VALLEY ROAD | $399,000 | $348,000 | 14.66 | $399,000 | 10-Aug-2020 | 2002 | 22-Oct-2020 | 669 | $596 | |
| 206 365 E 1ST STREET | $635,000 | $644,000 | -1.40 | $699,000 | 16-Jun-2020 | 1999 | 22-Oct-2020 | 840 | $755 | |
| 521 723 W 3RD STREET | $720,000 | $695,000 | 3.60 | $729,000 | 14-Oct-2020 | 2015 | 22-Oct-2020 | 804 | $895 | Renovated/updated. |
| 214 3220 CONNAUGHT CRESCENT | $1,060,000 | $1,061,000 | -0.09 | $1,368,000 | 12-Jun-2019 | 2019 | 23-Oct-2020 | 897 | $1,181 | |
| 211 123 W 1ST STREET | $1,050,000 | $1,054,000 | -0.38 | $1,045,000 | 13-Oct-2020 | 2016 | 25-Oct-2020 | 1,065 | $985 | |
| 510 255 W 1ST STREET | $826,000 | $823,000 | 0.36 | $845,000 | 08-Sep-2020 | 2017 | 25-Oct-2020 | 889 | $929 | |
| 208 719 W 3RD STREET | $640,000 | $608,000 | 5.26 | $679,000 | 10-Jul-2020 | 2017 | 25-Oct-2020 | 741 | $863 | |
| 203 3125 CAPILANO CRESCENT | $915,000 | $949,000 | -3.58 | $948,000 | 20-Oct-2020 | 2003 | 26-Oct-2020 | 1,384 | $661 | |
| 206 131 E 3RD STREET | $750,000 | $746,000 | 0.54 | $825,000 | 03-Jun-2020 | 2016 | 28-Oct-2020 | 794 | $944 | |
| 324 255 W 1ST STREET | $1,155,000 | $1,149,000 | 0.52 | $1,175,000 | 22-Oct-2020 | 2017 | 28-Oct-2020 | 1,293 | $893 | |
| 310 1677 LLOYD AVENUE | $565,000 | $531,000 | 6.40 | $579,000 | 06-Oct-2020 | 2011 | 29-Oct-2020 | 665 | $849 | |
| 207 137 E 1ST STREET | $726,000 | $643,000 | 12.91 | $679,000 | 26-Oct-2020 | 1998 | 02-Nov-2020 | 996 | $728 | Renovated/updated. |
13 out of 28 unrenovated resale homes sold below assessed with a median sold price of 0.44
Delta
| Address | Sold Price | Assessed | % Δ | True List Price | True List Date | Year Built | Sold Date | Sqft | Price per sqft | Notes |
|---|---|---|---|---|---|---|---|---|---|---|
| 307 7511 120 STREET | $443,000 | $420,000 | 5.48 | $425,000 | 05-Oct-2020 | 2012 | 08-Oct-2020 | 902 | $491 | |
| 408 1166 54A STREET | $685,000 | $622,000 | 10.13 | $719,000 | 04-Oct-2020 | 2015 | 11-Oct-2020 | 1,055 | $649 | |
| 104 1140 55 STREET | $550,000 | $528,000 | 4.17 | $575,000 | 09-Sep-2019 | 1990 | 11-Oct-2020 | 1,390 | $395 | Renovated/updated. |
| 412 5599 14B AVENUE | $475,000 | $497,000 | -4.43 | $499,000 | 27-Aug-2020 | 2011 | 12-Oct-2020 | 950 | $500 | |
| 201 1315 56 STREET | $460,000 | $388,000 | 18.56 | $459,900 | 08-Oct-2020 | 2007 | 12-Oct-2020 | 796 | $577 | |
| 306 4803 48 AVENUE | $595,000 | $536,700 | 10.86 | $595,000 | 09-Oct-2020 | 1985 | 13-Oct-2020 | 1,207 | $492 | |
| 418 7511 120 STREET | $420,000 | $382,000 | 9.95 | $488,000 | 05-Aug-2020 | 2012 | 17-Oct-2020 | 807 | $520 | Renovated/updated. |
| 302 1153 54A STREET | $445,000 | $483,000 | -7.87 | $529,000 | 21-Mar-2019 | 1992 | 17-Oct-2020 | 1,172 | $379 | |
| 200 1150 54A STREET | $559,000 | $500,000 | 11.80 | $629,900 | 08-Aug-2019 | 1987 | 29-Oct-2020 | 1,363 | $410 | Renovated/updated. |
2 out of 6 unrenovated resale homes sold below assessed with a median sold price of 7.80
Surrey
| Address | Sold Price | Assessed | % Δ | True List Price | True List Date | Year Built | Sold Date | Sqft | Price per sqft | Notes |
|---|---|---|---|---|---|---|---|---|---|---|
| 114 17712 57A AVENUE | $404,000 | $382,000 | 5.76 | $429,900 | 03-Apr-2020 | 2009 | 08-Oct-2020 | 857 | $471 | |
| 2909 13325 102A AVENUE | $372,500 | $398,000 | -6.41 | $379,900 | 05-Oct-2020 | 2013 | 08-Oct-2020 | 610 | $610 | Renovated/updated. |
| 302 7475 138 STREET | $370,000 | $294,500 | 25.64 | $379,800 | 24-Aug-2020 | 1993 | 08-Oct-2020 | 929 | $398 | Renovated/updated. |
| 116 7151 121 STREET | $409,500 | $389,000 | 5.27 | $449,000 | 29-Jul-2020 | 1991 | 08-Oct-2020 | 1,170 | $350 | |
| 2301 13438 CENTRAL AVENUE | $335,000 | $347,000 | -3.46 | $388,800 | 13-Mar-2020 | 2019 | 08-Oct-2020 | 401 | $835 | |
| 312 15350 19A AVENUE | $446,000 | $446,000 | 0.00 | $474,000 | 03-Jul-2020 | 1976 | 08-Oct-2020 | 1,098 | $406 | |
| 407 15735 CROYDON DRIVE | $406,750 | $362,000 | 12.36 | $419,000 | 05-Oct-2020 | 2009 | 09-Oct-2020 | 724 | $561 | Renovated/updated. |
| 114 1870 E SOUTHMERE CRESCENT | $365,000 | $383,300 | -4.77 | $419,000 | 14-Feb-2020 | 1981 | 09-Oct-2020 | 927 | $393 | Renovated/updated. |
| 3108 13696 100 AVENUE | $393,000 | $388,000 | 1.29 | $425,000 | 09-Sep-2020 | 2017 | 09-Oct-2020 | 510 | $770 | |
| 101 15392 16A AVENUE | $352,000 | $358,000 | -1.68 | $363,800 | 18-Sep-2020 | 2004 | 09-Oct-2020 | 709 | $496 | |
| 210 15255 18 AVENUE | $427,500 | $463,000 | -7.67 | $495,000 | 07-Aug-2020 | 1987 | 09-Oct-2020 | 1,372 | $311 | Renovated/updated. |
| 101 9830 WHALLEY BOULEVARD | $382,400 | $331,800 | 15.25 | $399,000 | 16-Jul-2020 | 1994 | 10-Oct-2020 | 903 | $423 | Renovated/updated. |
| 803 13618 100 AVENUE | $375,000 | $356,000 | 5.34 | $398,000 | 14-Sep-2020 | 2008 | 10-Oct-2020 | 611 | $613 | |
| 311 15298 20 AVENUE | $445,000 | $395,000 | 12.66 | $368,800 | 02-Aug-2016 | 1996 | 10-Oct-2020 | 1,063 | $418 | |
| 427 15956 86A AVENUE | $380,000 | $348,000 | 9.20 | $374,900 | 08-Oct-2020 | 2013 | 10-Oct-2020 | 650 | $584 | Renovated/updated. |
| 1106 13380 108 AVENUE | $320,000 | $310,000 | 3.23 | $348,000 | 13-Aug-2020 | 2010 | 10-Oct-2020 | 484 | $661 | |
| 207 9763 140 STREET | $392,000 | $357,800 | 9.56 | $399,999 | 29-Sep-2020 | 1991 | 11-Oct-2020 | 1,030 | $380 | Renovated/updated. |
| 311 19201 66A AVENUE | $495,000 | $595,000 | -16.81 | $499,900 | 01-Oct-2020 | 2013 | 11-Oct-2020 | 1,172 | $422 | Renovated/updated. |
| 302 1725 MARTIN DRIVE | $742,500 | $628,000 | 18.23 | $750,000 | 08-Oct-2020 | 1993 | 11-Oct-2020 | 1,313 | $565 | Renovated/updated. |
| 106 15210 GUILDFORD DRIVE | $315,000 | $304,000 | 3.62 | $325,000 | 30-Sep-2020 | 1997 | 11-Oct-2020 | 730 | $431 | |
| 418 13897 FRASER HIGHWAY | $439,000 | $406,000 | 8.13 | $429,900 | 05-Oct-2020 | 2011 | 11-Oct-2020 | 807 | $543 | |
| 101 2960 151 STREET | $405,000 | $310,000 | 30.65 | $409,000 | 10-Sep-2020 | 2018 | 12-Oct-2020 | 691 | $586 | |
| 415 10237 133 STREET | $473,500 | $432,000 | 9.61 | $462,000 | 05-Oct-2020 | 2009 | 12-Oct-2020 | 935 | $506 | |
| 230 15988 26 AVENUE | $384,000 | $358,000 | 7.26 | $399,000 | 12-Aug-2020 | 2008 | 12-Oct-2020 | 654 | $587 | |
| 406 9655 KING GEORGE BOULEVARD | $344,000 | $323,900 | 6.21 | ? | 31-May-2012 | 2009 | 12-Oct-2020 | 603 | $570 | |
| 3901 13495 CENTRAL AVENUE | $488,000 | $459,000 | 6.32 | $524,000 | 21-Aug-2020 | 2018 | 12-Oct-2020 | 604 | $807 | |
| 202 5906 176A STREET | $300,000 | $294,800 | 1.76 | $305,000 | 04-Oct-2020 | 1982 | 13-Oct-2020 | 900 | $333 | |
| 604 13880 101 AVENUE | $325,000 | $278,000 | 16.91 | $339,000 | 02-Oct-2020 | 1994 | 13-Oct-2020 | 696 | $466 | Renovated/updated. |
| 408 9830 WHALLEY BOULEVARD | $420,000 | $390,600 | 7.53 | $494,800 | 24-Sep-2018 | 1994 | 13-Oct-2020 | 944 | $444 | Renovated/updated. |
| 106 6470 194 STREET | $518,000 | $418,000 | 23.92 | $524,900 | 09-Oct-2020 | 2017 | 13-Oct-2020 | 915 | $566 | |
| 808 13688 100 AVENUE | $428,000 | $406,000 | 5.42 | $439,000 | 07-Oct-2020 | 2011 | 13-Oct-2020 | 766 | $558 | |
| 305 19530 65 AVENUE | $442,500 | $440,000 | 0.57 | $469,900 | 27-Sep-2020 | 2011 | 14-Oct-2020 | 951 | $465 | |
| 2601 13438 CENTRAL AVENUE | $310,000 | $351,000 | -11.68 | $328,800 | 17-Sep-2020 | 2019 | 14-Oct-2020 | 401 | $773 | |
| 406 6480 195A STREET | $305,000 | $240,800 | 26.66 | $309,900 | 06-Oct-2020 | 2013 | 14-Oct-2020 | 474 | $643 | |
| 413 9983 E BARNSTON DRIVE | $427,900 | $431,000 | -0.72 | $429,900 | 16-Apr-2020 | 2018 | 14-Oct-2020 | 809 | $528 | Brand New. |
| 417 14333 104 AVENUE | $483,000 | $488,000 | -1.02 | $548,000 | 12-May-2020 | 2009 | 14-Oct-2020 | 1,280 | $377 | |
| 105 13728 108 AVENUE | $280,000 | $237,400 | 17.94 | $279,000 | 06-Oct-2020 | 2012 | 14-Oct-2020 | 537 | $521 | |
| 311 12733 72 AVENUE | $322,000 | $261,200 | 23.28 | $325,000 | 27-Aug-2020 | 1994 | 14-Oct-2020 | 670 | $480 | |
| 707 13618 100 AVENUE | $418,000 | $398,000 | 5.03 | $428,000 | 05-Oct-2020 | 2008 | 14-Oct-2020 | 743 | $562 | |
| 305 10822 CITY PARKWAY | $400,000 | $393,000 | 1.78 | $424,999 | 03-Sep-2020 | 2009 | 15-Oct-2020 | 848 | $471 | |
| 429 15380 102A AVENUE | $525,000 | $541,000 | -2.96 | $342,777 | 18-Apr-2012 | 2006 | 15-Oct-2020 | 1,210 | $433 | |
| 118 13918 72 AVENUE | $390,000 | $328,800 | 18.61 | $408,000 | 06-Oct-2020 | 1989 | 15-Oct-2020 | 993 | $392 | Renovated/updated. |
| 311 10468 148 STREET | $280,000 | $275,300 | 1.71 | $319,900 | 31-Aug-2020 | 1984 | 16-Oct-2020 | 742 | $377 | |
| 407 8115 121A STREET | $499,000 | $446,000 | 11.88 | $538,800 | 07-Oct-2019 | 1999 | 16-Oct-2020 | 1,428 | $349 | |
| 122 7161 121 STREET | $415,000 | $388,000 | 6.96 | $430,000 | 24-Aug-2020 | 1991 | 16-Oct-2020 | 1,201 | $345 | Renovated/updated. |
| 104 12890 17 AVENUE | $385,000 | $318,100 | 21.03 | $425,000 | 22-Sep-2020 | 1978 | 16-Oct-2020 | 1,076 | $357 | Renovated/updated. |
| 1209 10777 UNIVERSITY DRIVE | $361,000 | $342,000 | 5.56 | $372,000 | 20-Apr-2020 | 2010 | 16-Oct-2020 | 570 | $633 | |
| 206 15150 29A AVENUE | $385,000 | $328,000 | 17.38 | $409,900 | 06-Jun-2020 | 1997 | 17-Oct-2020 | 910 | $423 | Renovated/updated. |
| 338 15850 26 AVENUE | $450,000 | $459,000 | -1.96 | $470,000 | 30-Jun-2020 | 2010 | 17-Oct-2020 | 814 | $552 | |
| 209 6490 194 STREET | $497,000 | $429,000 | 15.85 | $479,900 | 01-Oct-2018 | 2017 | 17-Oct-2020 | 914 | $543 | |
| 311 10822 CITY PARKWAY | $378,950 | $342,000 | 10.80 | $398,900 | 24-Jul-2020 | 2009 | 17-Oct-2020 | 745 | $508 | |
| 1009 13688 100 AVENUE | $490,000 | $463,000 | 5.83 | $519,800 | 14-Sep-2020 | 2011 | 17-Oct-2020 | 844 | $580 | |
| 103 15140 29A AVENUE | $505,000 | $455,000 | 10.99 | $509,900 | 23-Sep-2020 | 1996 | 17-Oct-2020 | 1,179 | $428 | |
| 306 13339 102A AVENUE | $334,000 | $326,000 | 2.45 | $359,000 | 27-Jul-2020 | 2009 | 18-Oct-2020 | 583 | $572 | |
| 2413 13438 CENTRAL AVENUE | $335,000 | $337,000 | -0.59 | $368,800 | 02-Jul-2020 | 2019 | 18-Oct-2020 | 388 | $863 | |
| 201 8717 160 STREET | $420,000 | $411,000 | 2.19 | $445,000 | 09-Sep-2020 | 2008 | 18-Oct-2020 | 890 | $471 | |
| 612 14333 104 AVENUE | $485,000 | $449,000 | 8.02 | $535,000 | 18-Aug-2020 | 2009 | 18-Oct-2020 | 1,113 | $435 | Renovated/updated. |
| 1106 10899 UNIVERSITY DRIVE | $315,000 | $304,000 | 3.62 | $319,900 | 13-Oct-2020 | 1995 | 18-Oct-2020 | 674 | $467 | |
| 111 15145 36 AVENUE | $608,000 | $589,000 | 3.23 | $649,000 | 28-Jun-2020 | 2012 | 18-Oct-2020 | 998 | $609 | |
| 405 15168 33 AVENUE | $529,000 | $477,000 | 10.90 | $339,900 | 03-Apr-2016 | 2016 | 19-Oct-2020 | 863 | $612 | |
| 2104 9981 WHALLEY BOULEVARD | $494,000 | $536,000 | -7.84 | $538,000 | 24-Aug-2020 | 2011 | 19-Oct-2020 | 899 | $549 | |
| 301 13321 102A AVENUE | $376,000 | $368,000 | 2.17 | $390,000 | 30-Jun-2020 | 2009 | 19-Oct-2020 | 671 | $560 | |
| 201 13316 OLD YALE ROAD | $350,000 | $353,600 | -1.02 | $359,900 | 13-Oct-2020 | 1981 | 19-Oct-2020 | 962 | $363 | Renovated/updated. |
| 3606 13495 CENTRAL AVENUE | $700,000 | $757,000 | -7.53 | $759,900 | 13-Aug-2020 | 2018 | 19-Oct-2020 | 1,023 | $684 | Renovated/updated. |
| 304 17661 58A AVENUE | $307,000 | $297,100 | 3.33 | $314,900 | 08-Oct-2020 | 1982 | 19-Oct-2020 | 903 | $339 | |
| 207 15388 105 AVENUE | $414,000 | $384,000 | 7.81 | $410,000 | 13-Oct-2020 | 2014 | 19-Oct-2020 | 737 | $561 | |
| 401 13925 FRASER HIGHWAY | $405,000 | $392,000 | 3.32 | $399,000 | 16-Oct-2020 | 2014 | 19-Oct-2020 | 721 | $561 | |
| 103 1630 154 STREET | $498,000 | $372,000 | 33.87 | $529,000 | 16-Jul-2018 | 1996 | 19-Oct-2020 | 1,038 | $479 | Renovated/updated. |
| 318 7171 121 STREET | $399,000 | $397,000 | 0.50 | $399,000 | 14-Oct-2020 | 1991 | 19-Oct-2020 | 1,162 | $343 | |
| 101 2970 KING GEORGE BOULEVARD | $428,000 | $333,000 | 28.53 | $428,000 | 13-Oct-2020 | 2009 | 19-Oct-2020 | 720 | $594 | |
| 107 15238 100 AVENUE | $340,000 | $301,900 | 12.62 | $299,000 | 08-Oct-2020 | 1981 | 19-Oct-2020 | 936 | $363 | |
| 110 6557 121 STREET | $332,000 | $281,000 | 18.15 | $345,000 | 01-Oct-2020 | 1997 | 20-Oct-2020 | 788 | $421 | |
| 411 2855 156 STREET | $520,000 | $691,000 | -24.75 | $565,000 | 17-Jun-2020 | 2016 | 20-Oct-2020 | 1,195 | $435 | |
| 102 15140 108 AVENUE | $350,000 | $348,200 | 0.52 | $379,900 | 01-Sep-2020 | 1993 | 20-Oct-2020 | 929 | $376 | Renovated/updated. |
| 407 13501 96 AVENUE | $286,000 | $267,900 | 6.76 | $289,900 | 19-Oct-2020 | 1983 | 20-Oct-2020 | 775 | $369 | |
| 407 1685 152A STREET | $525,000 | $404,000 | 29.95 | $549,000 | 06-Oct-2020 | 2001 | 20-Oct-2020 | 1,005 | $522 | Renovated/updated. |
| 206 15140 108 AVENUE | $432,000 | $399,000 | 8.27 | $439,900 | 01-Oct-2020 | 1993 | 20-Oct-2020 | 1,050 | $411 | Renovated/updated. |
| 303 6490 194 STREET | $695,000 | $641,000 | 8.42 | $724,900 | 27-Aug-2020 | 2019 | 20-Oct-2020 | 1,358 | $511 | |
| 307 14333 104 AVENUE | $492,000 | $394,000 | 24.87 | $499,000 | 01-Sep-2020 | 2009 | 20-Oct-2020 | 1,073 | $458 | |
| 410 9979 140 ST STREET | $343,000 | $294,100 | 16.63 | $350,000 | 22-Sep-2020 | 1996 | 20-Oct-2020 | 652 | $526 | |
| 313 16137 83 AVENUE | $440,000 | $365,000 | 20.55 | $450,000 | 24-Sep-2020 | 1994 | 22-Oct-2020 | 995 | $442 | Renovated/updated. |
| 410 13339 102A AVENUE | $380,000 | $375,000 | 1.33 | $389,000 | 14-Oct-2020 | 2009 | 22-Oct-2020 | 661 | $574 | |
| 210 19366 65 AVENUE | $420,000 | $403,000 | 4.22 | $424,900 | 21-Oct-2020 | 2005 | 22-Oct-2020 | 859 | $488 | |
| 215 13277 108 AVENUE | $331,000 | $273,000 | 21.25 | $339,900 | 30-Sep-2020 | 2008 | 23-Oct-2020 | 592 | $559 | Renovated/updated. |
| 204 15282 19 AVENUE | $414,000 | $437,900 | -5.46 | $425,000 | 20-Oct-2020 | 1982 | 23-Oct-2020 | 1,131 | $366 | Renovated/updated. |
| 303 15265 17A AVENUE | $409,000 | $402,000 | 1.74 | $424,900 | 07-Oct-2020 | 2004 | 23-Oct-2020 | 842 | $485 | |
| 224 14968 101A AVENUE | $377,500 | $312,000 | 20.99 | $389,900 | 10-Sep-2020 | 2019 | 23-Oct-2020 | 566 | $666 | Renovated/updated. |
| 10566 HOLLY PARK LANE | $320,000 | $338,100 | -5.35 | $348,000 | 15-Aug-2020 | 1977 | 24-Oct-2020 | 850 | $376 | Renovated/updated. |
| 104 9767 140 STREET | $390,000 | $357,300 | 9.15 | $395,000 | 05-Oct-2020 | 1991 | 27-Oct-2020 | 1,050 | $371 | Renovated/updated. |
| 4114 1222 KING GEORGE BOULEVARD | $360,000 | $255,000 | 41.18 | $438,800 | 21-Sep-2020 | 1997 | 28-Oct-2020 | 838 | $429 | |
| 4015 13696 100 AVENUE | $402,000 | $400,000 | 0.50 | $458,000 | 05-Sep-2020 | 2017 | 31-Oct-2020 | 512 | $785 |
7 out of 57 unrenovated resale homes sold below assessed with a median sold price of 5.34
Port Moody
| Address | Sold Price | Assessed | % Δ | True List Price | True List Date | Year Built | Sold Date | Sqft | Price per sqft | Notes |
|---|---|---|---|---|---|---|---|---|---|---|
| 313 200 KLAHANIE DRIVE | $605,000 | $574,000 | 5.40 | $619,900 | 17-Sep-2020 | 2005 | 08-Oct-2020 | 851 | $710 | Renovated/updated. |
| 301 260 NEWPORT DRIVE | $460,000 | $404,100 | 13.83 | $469,900 | 06-Oct-2020 | 1998 | 10-Oct-2020 | 678 | $678 | Renovated/updated. |
| 427 801 KLAHANIE DRIVE | $584,989 | $548,000 | 6.75 | $585,999 | 28-Sep-2020 | 2005 | 10-Oct-2020 | 843 | $693 | |
| 801 660 NOOTKA WAY | $652,500 | $572,000 | 14.07 | $659,900 | 28-Sep-2020 | 2009 | 10-Oct-2020 | 923 | $706 | |
| 218 285 NEWPORT DRIVE | $490,000 | $513,000 | -4.48 | ? | 02-Aug-2012 | 2002 | 12-Oct-2020 | 893 | $548 | |
| 409 121 BREW STREET | $630,000 | $615,000 | 2.44 | $669,000 | 10-Feb-2020 | 2008 | 16-Oct-2020 | 1,010 | $623 | |
| 212 300 KLAHANIE DRIVE | $689,800 | $661,000 | 4.36 | $689,800 | 17-Sep-2020 | 2005 | 18-Oct-2020 | 1,028 | $671 | |
| 311 200 CAPILANO ROAD | $627,000 | $564,000 | 11.17 | $609,000 | 13-Oct-2020 | 2005 | 21-Oct-2020 | 940 | $667 | Renovated/updated. |
| 103 3099 TERRAVISTA PLACE | $445,000 | $403,000 | 10.42 | $450,000 | 19-Oct-2020 | 1998 | 23-Oct-2020 | 750 | $593 | Renovated/updated. |
| 208 200 KLAHANIE DRIVE | $580,000 | $568,000 | 2.11 | $599,900 | 07-Aug-2020 | 2005 | 23-Oct-2020 | 839 | $691 | Renovated/updated. |
| 411 3142 ST JOHNS STREET | $412,000 | $393,800 | 4.62 | $445,000 | 22-Jun-2020 | 2003 | 23-Oct-2020 | 605 | $680 | |
| 212 3142 ST JOHNS STREET | $420,000 | $381,600 | 10.06 | $433,800 | 18-Aug-2020 | 2003 | 26-Oct-2020 | 623 | $674 | Renovated/updated. |
1 out of 6 unrenovated resale homes sold below assessed with a median sold price of 4.49
Coquitlam
| Address | Sold Price | Assessed | % Δ | True List Price | True List Date | Year Built | Sold Date | Sqft | Price per sqft | Notes |
|---|---|---|---|---|---|---|---|---|---|---|
| 302 511 ROCHESTER AVENUE | $509,000 | $502,000 | 1.39 | $528,800 | 04-Aug-2020 | 2007 | 08-Oct-2020 | 900 | $565 | |
| 225 99 BEGIN STREET | $409,000 | $413,000 | -0.97 | $409,000 | 07-Oct-2020 | 1989 | 08-Oct-2020 | 872 | $469 | Renovated/updated. |
| 123 99 BEGIN STREET | $405,000 | $435,000 | -6.90 | $434,900 | 14-Jun-2020 | 1989 | 09-Oct-2020 | 886 | $457 | Renovated/updated. |
| 314 1330 GENEST WAY | $585,500 | $580,000 | 0.95 | $598,800 | 08-Sep-2020 | 2008 | 09-Oct-2020 | 980 | $597 | |
| 507 3102 WINDSOR GATE | $720,000 | $682,000 | 5.57 | $749,000 | 23-Sep-2020 | 2012 | 09-Oct-2020 | 1,006 | $715 | |
| 909 1188 PINETREE WAY | $613,000 | $601,000 | 2.00 | $638,888 | 22-Jul-2020 | 2016 | 10-Oct-2020 | 839 | $730 | |
| 702 530 WHITING WAY | $610,000 | $584,000 | 4.45 | $649,900 | 02-Sep-2020 | 2019 | 10-Oct-2020 | 802 | $760 | Renovated/updated. |
| 104 1152 WINDSOR MEWS | $689,000 | $644,000 | 6.99 | $890,000 | 13-Jul-2020 | 2016 | 10-Oct-2020 | 980 | $703 | |
| 304 518 WHITING WAY | $575,000 | $578,000 | -0.52 | $638,800 | 10-Aug-2020 | 2018 | 11-Oct-2020 | 794 | $724 | |
| 305 827 RODERICK AVENUE | $518,000 | $511,000 | 1.37 | $374,000 | 26-Jan-2012 | 2014 | 11-Oct-2020 | 827 | $626 | |
| 412 617 SMITH AVENUE | $470,000 | $518,000 | -9.27 | $589,000 | 16-Jun-2020 | 2013 | 11-Oct-2020 | 746 | $630 | |
| 203 1151 WINDSOR MEWS | $544,000 | $530,000 | 2.64 | $565,000 | 20-Aug-2020 | 2016 | 11-Oct-2020 | 864 | $629 | |
| 407 1591 BOOTH AVENUE | $470,000 | $450,000 | 4.44 | $475,000 | 05-Oct-2020 | 1995 | 11-Oct-2020 | 885 | $531 | Renovated/updated. |
| 406 530 WHITING WAY | $744,000 | $703,000 | 5.83 | $768,800 | 06-Oct-2020 | 2019 | 12-Oct-2020 | 971 | $766 | |
| 1609 2975 ATLANTIC AVENUE | $472,000 | $439,000 | 7.52 | $485,000 | 21-Sep-2020 | 2014 | 12-Oct-2020 | 610 | $773 | |
| 902 2959 GLEN DRIVE | $567,440 | $510,000 | 11.26 | $572,800 | 07-Oct-2020 | 2009 | 12-Oct-2020 | 886 | $640 | |
| 302 1128 KENSAL PLACE | $452,000 | $431,000 | 4.87 | ? | 16-Jul-2013 | 2012 | 13-Oct-2020 | 675 | $669 | |
| 303 1242 TOWN CENTRE BOULEVARD | $429,000 | $426,000 | 0.70 | $429,900 | 12-Oct-2020 | 1996 | 13-Oct-2020 | 755 | $568 | |
| 108 1428 PARKWAY BOULEVARD | $510,000 | $495,000 | 3.03 | $519,900 | 30-Jun-2020 | 1998 | 13-Oct-2020 | 864 | $590 | Renovated/updated. |
| 101 555 AUSTIN AVENUE | $500,000 | $549,000 | -8.93 | $629,000 | 28-May-2019 | 1990 | 13-Oct-2020 | 1,162 | $430 | |
| 2206 3080 LINCOLN AVENUE | $488,000 | $449,000 | 8.69 | $498,000 | 06-Oct-2020 | 2016 | 13-Oct-2020 | 595 | $820 | |
| 132 1252 TOWN CENTRE BOULEVARD | $538,800 | $516,000 | 4.42 | $578,800 | 30-Jul-2018 | 1996 | 14-Oct-2020 | 990 | $544 | Renovated/updated. |
| 217 3178 DAYANEE SPRINGS BOULEVARD | $545,000 | $537,000 | 1.49 | $550,000 | 28-Sep-2020 | 2012 | 14-Oct-2020 | 870 | $626 | |
| 1301 3007 GLEN DRIVE | $500,000 | $490,000 | 2.04 | $499,800 | 06-Oct-2020 | 2015 | 14-Oct-2020 | 630 | $793 | |
| 105 3085 PRIMROSE LANE | $377,500 | $362,000 | 4.28 | $425,000 | 06-Aug-2020 | 1996 | 14-Oct-2020 | 859 | $439 | Renovated/updated. |
| 211 1151 WINDSOR MEWS | $650,000 | $668,000 | -2.69 | $709,900 | 11-Sep-2019 | 2016 | 15-Oct-2020 | 1,208 | $538 | |
| 109 2985 PRINCESS CRESCENT | $495,000 | $408,000 | 21.32 | $518,800 | 17-Aug-2020 | 1994 | 15-Oct-2020 | 1,054 | $469 | Renovated/updated. |
| 1805 1188 PINETREE WAY | $632,500 | $596,000 | 6.12 | $649,000 | 09-Oct-2020 | 2016 | 16-Oct-2020 | 809 | $781 | Renovated/updated. |
| 124 98 LAVAL STREET | $380,000 | $302,600 | 25.58 | ? | 29-Aug-2011 | 1990 | 17-Oct-2020 | 635 | $598 | Renovated/updated. |
| 205 3156 DAYANEE SPRINGS BOULEVARD | $590,000 | $548,000 | 7.66 | $649,900 | 14-Sep-2020 | 2012 | 17-Oct-2020 | 917 | $643 | Renovated/updated. |
| 201 455 BROMLEY STREET | $490,000 | $489,000 | 0.20 | $549,900 | 01-Jun-2020 | 1989 | 18-Oct-2020 | 1,221 | $401 | Renovated/updated. |
| 214 932 ROBINSON STREET | $379,000 | $308,000 | 23.05 | $379,000 | 22-Sep-2020 | 1983 | 18-Oct-2020 | 706 | $536 | Renovated/updated. |
| 905 511 ROCHESTER AVENUE | $435,000 | $404,000 | 7.67 | $449,800 | 01-Sep-2020 | 2007 | 18-Oct-2020 | 657 | $662 | |
| 212 607 COTTONWOOD AVENUE | $520,000 | $496,000 | 4.84 | $559,000 | 15-Sep-2020 | 2017 | 18-Oct-2020 | 773 | $672 | |
| 1804 3100 WINDSOR GATE | $628,000 | $598,000 | 5.02 | $638,000 | 23-Sep-2020 | 2018 | 19-Oct-2020 | 827 | $759 | |
| 106 2969 WHISPER WAY | $550,000 | $477,000 | 15.30 | $625,000 | 05-Dec-2018 | 2005 | 19-Oct-2020 | 864 | $636 | Renovated/updated. |
| 1202 1180 PINETREE WAY | $518,800 | $509,000 | 1.93 | $596,000 | 15-May-2019 | 1990 | 20-Oct-2020 | 916 | $566 | Renovated/updated. |
| 205 3050 DAYANEE SPRINGS BOULEVARD | $619,000 | $584,000 | 5.99 | ? | 02-Nov-2010 | 2008 | 20-Oct-2020 | 1,001 | $618 | |
| 71 202 LAVAL STREET | $499,000 | $467,000 | 6.85 | $539,000 | 31-Aug-2020 | 1993 | 20-Oct-2020 | 1,172 | $425 | Renovated/updated. |
| 407 3156 DAYANEE SPRINGS BOULEVARD | $435,000 | $409,000 | 6.36 | $440,000 | 08-Oct-2020 | 2012 | 20-Oct-2020 | 620 | $701 | |
| 206 1242 TOWN CENTRE BOULEVARD | $410,000 | $401,000 | 2.24 | $448,900 | 08-Aug-2018 | 1996 | 21-Oct-2020 | 678 | $604 | |
| 403 1152 WINDSOR MEWS | $535,000 | $540,000 | -0.93 | $434,900 | 25-Sep-2016 | 2016 | 22-Oct-2020 | 864 | $619 | |
| 2201 602 COMO LAKE AVENUE | $498,000 | $417,000 | 19.42 | $499,900 | 20-Oct-2020 | 2017 | 23-Oct-2020 | 578 | $861 | |
| 803 1196 PIPELINE ROAD | $543,000 | $492,000 | 10.37 | $549,000 | 20-Oct-2020 | 1997 | 24-Oct-2020 | 1,013 | $536 | |
| 508 555 DELESTRE AVENUE | $325,000 | $274,700 | 18.31 | $349,000 | 27-Jul-2020 | 2008 | 24-Oct-2020 | 373 | $871 | |
| 216 553 FOSTER AVENUE | $401,000 | $419,000 | -4.30 | $480,000 | 07-Aug-2020 | 2012 | 25-Oct-2020 | 611 | $656 | |
| 511 1152 WINDSOR MEWS | $630,000 | $564,000 | 11.70 | $499,900 | 25-Nov-2016 | 2016 | 26-Oct-2020 | 900 | $700 | Renovated/updated. |
| 308 1185 THE HIGH STREET | $435,000 | $418,000 | 4.07 | $448,800 | 04-Aug-2020 | 2009 | 26-Oct-2020 | 582 | $747 |
6 out of 30 unrenovated resale homes sold below assessed with a median sold price of 3.35
Port Coquitlam
| Address | Sold Price | Assessed | % Δ | True List Price | True List Date | Year Built | Sold Date | Sqft | Price per sqft | Notes |
|---|---|---|---|---|---|---|---|---|---|---|
| 225 2551 PARKVIEW LANE | $465,000 | $459,000 | 1.31 | $489,900 | 08-Sep-2020 | 1995 | 08-Oct-2020 | 1,034 | $449 | Renovated/updated. |
| 212 2558 PARKVIEW LANE | $438,000 | $389,000 | 12.60 | $449,900 | 05-Oct-2020 | 1996 | 08-Oct-2020 | 845 | $518 | Renovated/updated. |
| 606 2465 WILSON AVENUE | $380,000 | $358,000 | 6.15 | $369,900 | 06-Oct-2020 | 2016 | 10-Oct-2020 | 528 | $719 | |
| 403 2393 RANGER LANE | $430,000 | $377,000 | 14.06 | $430,000 | 07-Oct-2020 | 2018 | 11-Oct-2020 | 595 | $722 | |
| 318 2307 RANGER LANE | $350,000 | $352,000 | -0.57 | $377,000 | 17-Aug-2020 | 2016 | 13-Oct-2020 | 586 | $597 | |
| 301 1999 SUFFOLK AVENUE | $545,000 | $545,000 | 0.00 | $550,000 | 01-Oct-2020 | 1997 | 13-Oct-2020 | 1,191 | $457 | Renovated/updated. |
| 107 2484 WILSON AVENUE | $533,000 | $512,000 | 4.10 | $549,900 | 21-Sep-2020 | 2008 | 14-Oct-2020 | 1,052 | $506 | |
| 110 1669 GRANT AVENUE | $460,000 | $371,000 | 23.99 | $479,800 | 06-Jul-2020 | 1996 | 14-Oct-2020 | 901 | $510 | Renovated/updated. |
| 608 2465 WILSON AVENUE | $450,000 | $430,000 | 4.65 | $509,000 | 27-Oct-2018 | 2016 | 15-Oct-2020 | 680 | $661 | |
| 103 1570 PRAIRIE AVENUE | $420,000 | $369,000 | 13.82 | $300,000 | 24-Jan-2017 | 1995 | 15-Oct-2020 | 913 | $460 | Renovated/updated. |
| 402 2388 WELCHER AVENUE | $480,000 | $406,000 | 18.23 | $475,000 | 05-Oct-2020 | 1994 | 15-Oct-2020 | 960 | $500 | Renovated/updated. |
| 306 2436 KELLY AVENUE | $473,550 | $440,000 | 7.62 | $475,000 | 06-Nov-2019 | 2019 | 16-Oct-2020 | 770 | $615 | |
| 23 2444 WILSON AVENUE | $308,000 | $294,900 | 4.44 | $324,900 | 08-Sep-2020 | 1973 | 17-Oct-2020 | 880 | $350 | |
| 316 2627 SHAUGHNESSY STREET | $542,000 | $482,000 | 12.45 | $560,000 | 30-Sep-2020 | 2008 | 18-Oct-2020 | 1,089 | $497 | |
| 308 2473 ATKINS AVENUE | $323,000 | $289,000 | 11.76 | $299,800 | 24-Sep-2020 | 2012 | 19-Oct-2020 | 501 | $644 | |
| 401 2378 WILSON AVENUE | $405,000 | $362,000 | 11.88 | $444,900 | 02-Jun-2020 | 1986 | 20-Oct-2020 | 998 | $405 | |
| 407 2307 RANGER LANE | $585,000 | $510,000 | 14.71 | $599,900 | 05-Oct-2020 | 2016 | 20-Oct-2020 | 900 | $650 | |
| 101 2343 ATKINS AVENUE | $430,000 | $380,000 | 13.16 | $439,900 | 13-Oct-2020 | 2011 | 20-Oct-2020 | 684 | $628 | |
| 304 1999 SUFFOLK AVENUE | $395,000 | $407,000 | -2.95 | $409,500 | 27-Jul-2020 | 1997 | 21-Oct-2020 | 829 | $476 | |
| 208 2346 MCALLISTER AVENUE | $392,000 | $391,000 | 0.26 | $389,900 | 14-Oct-2020 | 2006 | 21-Oct-2020 | 732 | $535 | |
| 311 2339 SHAUGHNESSY STREET | $426,000 | $438,000 | -2.74 | $449,900 | 17-Sep-2020 | 1990 | 23-Oct-2020 | 1,112 | $383 | |
| 312 2484 WILSON AVENUE | $520,000 | $512,000 | 1.56 | $547,000 | 15-Jul-2020 | 2008 | 23-Oct-2020 | 1,043 | $498 | |
| 301 2109 ROWLAND STREET | $450,000 | $367,000 | 22.62 | $265,000 | 21-Oct-2014 | 1994 | 25-Oct-2020 | 1,023 | $439 | Renovated/updated. |
| 103 2485 ATKINS AVENUE | $445,000 | $398,000 | 11.81 | $399,999 | 13-Oct-2020 | 1995 | 25-Oct-2020 | 905 | $491 | Renovated/updated. |
| 206 2484 WILSON AVENUE | $561,000 | $483,000 | 16.15 | $530,000 | 19-Oct-2020 | 2008 | 27-Oct-2020 | 952 | $589 | Renovated/updated. |
3 out of 15 unrenovated resale homes sold below assessed with a median sold price of 4.65
Pitt Meadows
| Address | Sold Price | Assessed | % Δ | True List Price | True List Date | Year Built | Sold Date | Sqft | Price per sqft | Notes |
|---|---|---|---|---|---|---|---|---|---|---|
| 304 11950 HARRIS ROAD | $365,000 | $307,000 | 18.89 | $375,900 | 03-Sep-2020 | 2008 | 08-Oct-2020 | 635 | $574 | Renovated/updated. |
| 105 12565 190A STREET | $495,000 | $462,000 | 7.14 | $519,900 | 10-Dec-2019 | 2012 | 09-Oct-2020 | 900 | $550 | |
| 202 19241 FORD ROAD | $391,800 | $376,000 | 4.20 | $399,900 | 01-Oct-2020 | 1992 | 11-Oct-2020 | 1,158 | $338 | |
| 424 12350 HARRIS ROAD | $476,500 | $408,000 | 16.79 | $479,900 | 08-Sep-2020 | 2007 | 12-Oct-2020 | 1,047 | $455 | |
| 302 12525 190A STREET | $465,000 | $483,000 | -3.73 | $495,000 | 30-Jul-2020 | 2012 | 14-Oct-2020 | 927 | $501 | |
| 112 19091 MCMYN ROAD | $415,000 | $404,000 | 2.72 | $469,000 | 10-Mar-2020 | 1998 | 17-Oct-2020 | 963 | $430 | Renovated/updated. |
| 211 12565 190A STREET | $374,000 | $357,000 | 4.76 | $389,900 | 02-Oct-2020 | 2012 | 18-Oct-2020 | 642 | $582 | |
| 109 19142 122 AVENUE | $445,000 | $404,000 | 10.15 | $449,900 | 21-Sep-2020 | 1994 | 22-Oct-2020 | 1,129 | $394 | Renovated/updated. |
1 out of 5 unrenovated resale homes sold below assessed with a median sold price of 4.76
Langley
| Address | Sold Price | Assessed | % Δ | True List Price | True List Date | Year Built | Sold Date | Sqft | Price per sqft | Notes |
|---|---|---|---|---|---|---|---|---|---|---|
| 403 20826 72 AVENUE | $415,000 | $498,000 | -16.67 | $466,900 | 22-Oct-2019 | 2019 | 08-Oct-2020 | 938 | $442 | |
| 501 8157 207 STREET | $410,000 | $410,000 | 0.00 | $418,800 | 25-Sep-2020 | 2016 | 09-Oct-2020 | 805 | $509 | Renovated/updated. |
| 468 8258 207A STREET | $529,800 | $558,000 | -5.05 | $524,800 | 23-Sep-2020 | 2014 | 09-Oct-2020 | 1,028 | $515 | |
| 302 20443 53 AVENUE | $330,000 | $381,000 | -13.39 | $350,000 | 06-Oct-2020 | 1994 | 10-Oct-2020 | 1,203 | $274 | Renovated/updated. |
| 406 19830 56 AVENUE | $399,900 | $429,000 | -6.78 | $449,900 | 05-Nov-2019 | 2008 | 10-Oct-2020 | 1,229 | $325 | |
| 104 20219 54A AVENUE | $405,000 | $411,000 | -1.46 | $400,000 | 05-Oct-2020 | 2011 | 10-Oct-2020 | 894 | $453 | |
| 440 5660 201A STREET | $345,000 | $354,000 | -2.54 | $349,900 | 17-Sep-2020 | 2009 | 10-Oct-2020 | 735 | $469 | |
| 203 5375 205 STREET | $304,000 | $349,000 | -12.89 | $359,900 | 11-May-2020 | 1990 | 12-Oct-2020 | 1,150 | $264 | |
| 467 8258 207A STREET | $525,000 | $558,000 | -5.91 | $534,900 | 04-Aug-2020 | 2014 | 14-Oct-2020 | 1,028 | $510 | |
| 210 5438 198 STREET | $382,000 | $363,000 | 5.23 | $395,000 | 24-Aug-2020 | 2005 | 15-Oct-2020 | 860 | $444 | |
| 314 22025 48 AVENUE | $408,000 | $407,000 | 0.25 | $419,500 | 01-Oct-2020 | 1993 | 15-Oct-2020 | 1,012 | $403 | Renovated/updated. |
| 106 5489 201 STREET | $407,000 | $351,000 | 15.95 | $439,900 | 26-Jun-2020 | 1993 | 16-Oct-2020 | 1,079 | $377 | Renovated/updated. |
| 401 19721 64 AVENUE | $496,000 | $388,000 | 27.84 | $519,900 | 12-Jun-2020 | 1990 | 16-Oct-2020 | 1,080 | $459 | Renovated/updated. |
| 209 20976 56 AVENUE | $384,900 | $333,000 | 15.59 | $409,000 | 03-Aug-2020 | 1992 | 17-Oct-2020 | 980 | $392 | Renovated/updated. |
| 120 20861 83 AVENUE | $520,000 | $492,000 | 5.69 | $534,900 | 24-Aug-2020 | 2013 | 17-Oct-2020 | 1,082 | $480 | |
| 102 20219 54A AVENUE | $325,000 | $285,000 | 14.04 | $325,000 | 12-Oct-2020 | 2011 | 17-Oct-2020 | 606 | $536 | |
| 304 5638 201A STREET | $490,000 | $445,000 | 10.11 | $529,000 | 15-Jul-2020 | 2019 | 19-Oct-2020 | 982 | $498 | |
| 304 23189 FRANCIS AVENUE | $1,717,000 | $1,482,000 | 15.86 | $1,717,000 | 13-Oct-2020 | 2018 | 19-Oct-2020 | 1,664 | $1,031 | |
| 314 21009 56 AVENUE | $385,000 | $390,000 | -1.28 | $399,000 | 09-Sep-2020 | 2011 | 21-Oct-2020 | 848 | $454 | |
| 326 22323 48 AVENUE | $505,000 | $468,000 | 7.91 | $529,900 | 15-Sep-2020 | 2010 | 21-Oct-2020 | 1,053 | $479 | |
| 202 20268 54 AVENUE | $323,000 | $307,000 | 5.21 | $324,900 | 13-Oct-2020 | 1997 | 22-Oct-2020 | 893 | $361 | Renovated/updated. |
| 125 8157 207 STREET | $549,900 | $468,000 | 17.50 | $599,999 | 26-Mar-2020 | 2016 | 23-Oct-2020 | 1,086 | $506 | |
| 207 23189 FRANCIS AVENUE | $915,000 | $741,000 | 23.48 | $849,900 | 16-Apr-2018 | 2018 | 23-Oct-2020 | 1,020 | $897 | |
| 113 5765 GLOVER ROAD | $350,000 | $363,100 | -3.61 | $374,800 | 29-Jul-2020 | 1995 | 23-Oct-2020 | 1,098 | $318 | Renovated/updated. |
| 340 22020 49 AVENUE | $444,000 | $387,000 | 14.73 | $449,900 | 20-Oct-2020 | 1997 | 24-Oct-2020 | 1,090 | $407 | Renovated/updated. |
7 out of 14 unrenovated resale homes sold below assessed with a median sold price of 1.98
Maple Ridge
| Address | Sold Price | Assessed | % Δ | True List Price | True List Date | Year Built | Sold Date | Sqft | Price per sqft | Notes |
|---|---|---|---|---|---|---|---|---|---|---|
| 602 12148 224 STREET | $459,900 | $450,000 | 2.20 | $464,900 | 13-Aug-2020 | 1999 | 09-Oct-2020 | 1,192 | $385 | |
| 402 11980 222 STREET | $271,000 | $237,400 | 14.15 | $279,900 | 28-Sep-2020 | 1988 | 13-Oct-2020 | 678 | $399 | Renovated/updated. |
| 202 22241 SELKIRK AVENUE | $343,000 | $309,300 | 10.90 | ? | 07-Jun-2011 | 1987 | 13-Oct-2020 | 1,396 | $245 | |
| 211 12310 222 STREET | $365,800 | $332,000 | 10.18 | $365,800 | 05-Oct-2020 | 2017 | 15-Oct-2020 | 721 | $507 | |
| 105 11519 BURNETT STREET | $377,450 | $376,000 | 0.39 | $389,900 | 28-Sep-2020 | 1995 | 20-Oct-2020 | 1,154 | $327 | Renovated/updated. |
| 307 12075 228 STREET | $390,000 | $392,000 | -0.51 | $399,900 | 26-Aug-2020 | 2008 | 22-Oct-2020 | 978 | $398 |
1 out of 4 unrenovated resale homes sold below assessed with a median sold price of 6.19
White Rock
| Address | Sold Price | Assessed | % Δ | True List Price | True List Date | Year Built | Sold Date | Sqft | Price per sqft | Notes |
|---|---|---|---|---|---|---|---|---|---|---|
| 702 15152 RUSSELL AVENUE | $945,000 | $928,000 | 1.83 | $949,000 | 02-Oct-2020 | 2009 | 10-Oct-2020 | 1,290 | $732 | |
| 302 15080 PROSPECT AVENUE | $515,000 | $496,000 | 3.83 | $595,000 | 17-Sep-2020 | 1984 | 10-Oct-2020 | 1,262 | $408 | Renovated/updated. |
| 204 1320 FIR STREET | $280,000 | $253,300 | 10.54 | $284,900 | 25-Sep-2019 | 1973 | 12-Oct-2020 | 913 | $306 | |
| 702 1473 JOHNSTON ROAD | $955,000 | $925,000 | 3.24 | $995,000 | 14-Feb-2020 | 2009 | 13-Oct-2020 | 1,290 | $740 | |
| 404 15991 THRIFT AVENUE | $459,900 | $475,000 | -3.18 | $459,900 | 06-Oct-2020 | 1991 | 14-Oct-2020 | 1,058 | $434 | Renovated/updated. |
| 203 1473 JOHNSTON ROAD | $620,000 | $556,000 | 11.51 | $639,000 | 30-Sep-2020 | 2009 | 15-Oct-2020 | 860 | $720 | Renovated/updated. |
| 106 14957 THRIFT AVENUE | $490,000 | $429,700 | 14.03 | $524,649 | 03-Sep-2020 | 1984 | 16-Oct-2020 | 1,155 | $424 | Renovated/updated. |
0 out of 3 unrenovated resale homes sold below assessed with a median sold price of 3.24