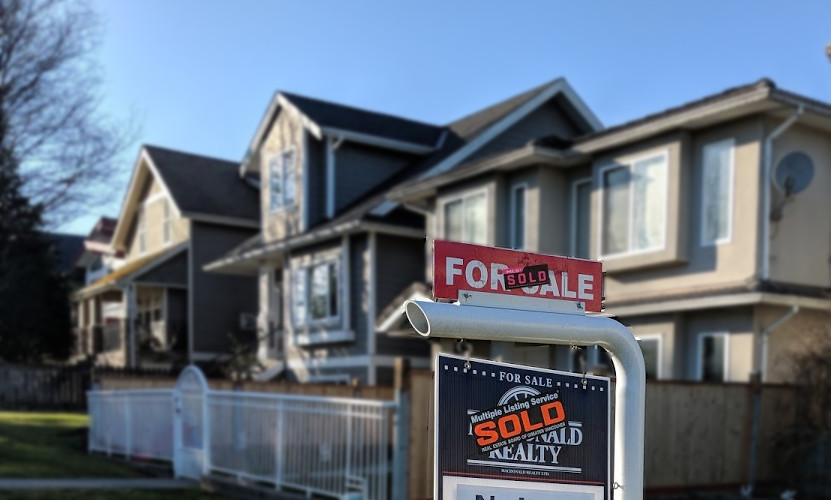
All 11 detached house flips in and around Vancouver in May 2019 ended up with the flipper losing money, with all selling for double digit percentage losses.
All flips in Vancouver, Richmond, Burnaby, West Vancouver, North Vancouver and New Westminster ended up with the seller getting less significantly less than what they paid for the property.
The most painful flop was recorded in North Vancouver with the property selling for 35% below what the seller, the numbered company 1067322 BC LTD, paid in August 2016.
The director of 1067322 BC LTD is listed as Linlin Zhang,
OpenHousing defines a flip as a home bought and sold within three years.
Vancouver
| Address | Year Built | Sold Price | Sold Date | Bought Price | Bought Date | Profit/Loss % |
|---|---|---|---|---|---|---|
| 3811 W 14TH AVENUE | 1922 | $3,700,000 | 08-May-2019 | $4,500,000 | 06-Sep-16 | -17.78 |
| 2073 W 45TH AVENUE | 1963 | $1,960,000 | 13-May-2019 | $2,650,000 | 06-Jun-18 | -26.04 |
| 2669 W 36TH AVENUE | 1989 | $4,750,000 | 16-May-2019 | $5,300,000 | 22-Jul-16 | -10.38 |
| 3626 W 37TH AVENUE | 1927 | $2,020,000 | 24-May-2019 | $2,618,000 | 16-Feb-17 | -22.84 |
Flip flops: 4 out of 4
Richmond
| Address | Year Built | Sold Price | Sold Date | Bought Price | Bought Date | Profit/Loss % |
|---|---|---|---|---|---|---|
| 5451 MAPLE ROAD | 1993 | $2,060,000 | 18-May-2019 | $2,400,000 | 02-May-16 | -14.17 |
Flip flops: 1 out of 1
Burnaby
| Address | Year Built | Sold Price | Sold Date | Bought Price | Bought Date | Profit/Loss % |
|---|---|---|---|---|---|---|
| 3 RANELAGH AVENUE | 1952 | $1,050,000 | 09-May-2019 | $1,215,000 | 20-Mar-18 | -13.58 |
Flip flops: 1 out of 1
West Vancouver
| Address | Year Built | Sold Price | Sold Date | Bought Price | Bought Date | Profit/Loss % |
|---|---|---|---|---|---|---|
| 1345 GORDON AVENUE | 1928 | $2,050,000 | 09-May-2019 | $2,780,000 | 16-Dec-16 | -26.26 |
| 2348 LAWSON AVENUE | 2015 | $3,660,000 | 15-May-2019 | $4,407,900 | 16-Jan-16 | -16.97 |
| 780 GREENWOOD ROAD | 2013 | $7,000,000 | 17-May-2019 | $8,500,000 | 14-Mar-16 | -17.65 |
Flip flops: 3 out of 3
New Westminster
| Address | Year Built | Sold Price | Sold Date | Bought Price | Bought Date | Profit/Loss % |
|---|---|---|---|---|---|---|
| 406 EIGHTH AVENUE | 1949 | $1,035,000 | 13-May-2019 | $1,160,000 | 18-Apr-17 | -10.78 |
Flip flops: 1 out of 1
North Vancouver
| Address | Year Built | Sold Price | Sold Date | Bought Price | Bought Date | Profit/Loss % |
|---|---|---|---|---|---|---|
| 3750 GLENVIEW CRESCENT | 1952 | $1,502,000 | 07-May-2019 | $2,295,000 | 31-Aug-16 | -34.55 |
Flip flops: 1 out of 1
Process finished with exit code 0
Dont worry everyone!
Even if the housing sales and prices are TANKING.
Realtors still get their exorbitant commissions.
Happy Housing CRASH buyers.
Catch that falling knife.
Make sure you enjoy that crappy bottle of wine the Realtor gave you after earning $25,000, $50k, $100k or more in commissions from the sale…. because, they’re your friend…… no really…..