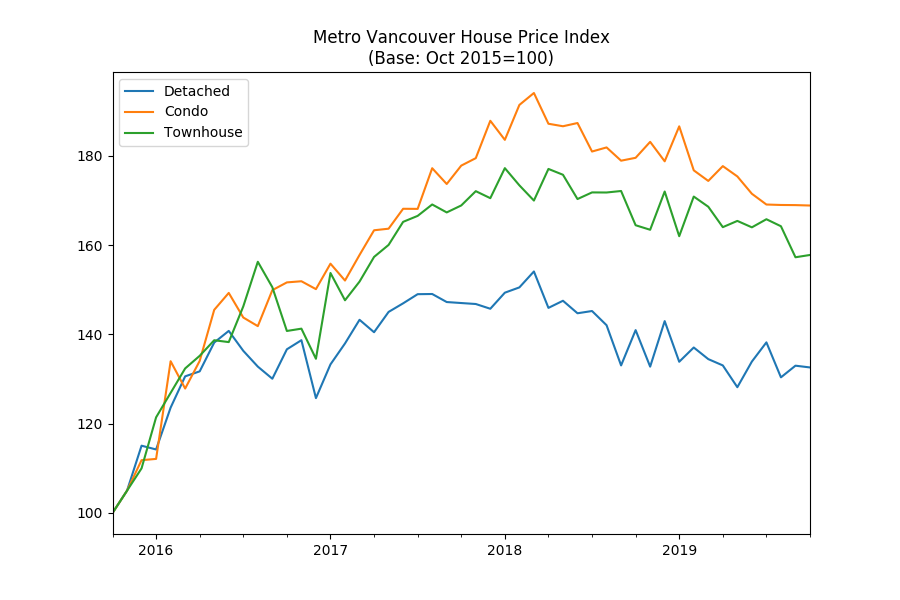
Metro Vancouver condo price decline continued on their downward trend into October, as increased sales volumes seen in the recent months failed to put upward pressure on the prices.
The OpenHousing Home Price Index for Metro Vancouver condos – calculated using the generally-accepted and transparent repeat sales or Case-Shiller method1 – fell 6% year-over-year, the October preliminary update shows.
Here’s what condo sales in the region looked like in the last 30 days.
Vancouver
| Address | Sold Price | Assessed | % Δ | True List Price | True List Date | Year Built | Sold Date | Sqft | Price per sqft | Notes |
|---|---|---|---|---|---|---|---|---|---|---|
| 1806 1500 HORNBY STREET | $1,500,000 | $1,753,000 | -14.43 | $1,799,000 | 06-May-2019 | 1993 | 02-Oct-2019 | 1,284 | $1,168 | Renovated/updated. |
| 2808 33 SMITHE STREET | $743,000 | $840,000 | -11.55 | $899,000 | 05-Apr-2018 | 2008 | 02-Oct-2019 | 693 | $1,072 | |
| 806 933 E HASTINGS STREET | $515,000 | $552,000 | -6.70 | $560,000 | 10-Jun-2019 | 2018 | 02-Oct-2019 | 592 | $869 | |
| 309 8450 JELLICOE STREET | $458,000 | $505,000 | -9.31 | $498,000 | 07-Mar-2019 | 1994 | 02-Oct-2019 | 770 | $594 | |
| 103 508 W 29TH AVENUE | $693,000 | $726,000 | -4.55 | $709,900 | 04-Sep-2019 | 2015 | 02-Oct-2019 | 613 | $1,130 | |
| 1210 788 HAMILTON STREET | $720,000 | $775,000 | -7.10 | $748,000 | 05-Sep-2019 | 2009 | 02-Oct-2019 | 734 | $980 | |
| 1005 3520 CROWLEY DRIVE | $325,000 | $367,000 | -11.44 | $325,000 | 30-Sep-2019 | 2001 | 02-Oct-2019 | 412 | $788 | |
| 2605 638 BEACH CRESCENT | $1,400,000 | $1,615,000 | -13.31 | $1,999,900 | 01-Jan-2019 | 2006 | 02-Oct-2019 | 1,070 | $1,308 | |
| 1206 969 RICHARDS STREET | $692,000 | $673,000 | 2.82 | $688,000 | 27-Sep-2019 | 2002 | 02-Oct-2019 | 635 | $1,089 | Renovated/updated. |
| PH8 5983 GRAY AVENUE | $900,000 | $1,163,000 | -22.61 | $1,238,000 | 24-Apr-2019 | 2013 | 02-Oct-2019 | 997 | $902 | |
| 1708 1188 RICHARDS STREET | $701,000 | $897,000 | -21.85 | $718,800 | 24-Sep-2019 | 1995 | 02-Oct-2019 | 718 | $976 | Renovated/updated. |
| 203 3905 SPRINGTREE DRIVE | $495,000 | $496,600 | -0.32 | $569,000 | 04-Sep-2018 | 1979 | 02-Oct-2019 | 672 | $736 | Renovated/updated. |
| 1204 1188 QUEBEC STREET | $835,000 | $892,000 | -6.39 | $849,900 | 09-Sep-2019 | 1992 | 02-Oct-2019 | 1,076 | $776 | |
| 904 1010 RICHARDS STREET | $570,000 | $678,000 | -15.93 | $585,000 | 27-Sep-2019 | 2003 | 02-Oct-2019 | 567 | $1,005 | |
| 303 1004 WOLFE AVENUE | $464,000 | $533,400 | -13.01 | $480,000 | 20-Sep-2019 | 1973 | 02-Oct-2019 | 780 | $594 | |
| 210 1445 MARPOLE AVENUE | $468,000 | $627,300 | -25.39 | $658,000 | 26-Nov-2018 | 1973 | 02-Oct-2019 | 754 | $620 | Renovated/updated. |
| 209 110 SWITCHMEN STREET | $625,000 | $658,000 | -5.02 | $598,000 | 30-Sep-2019 | 2014 | 02-Oct-2019 | 575 | $1,086 | |
| 407 1661 QUEBEC STREET | $525,000 | $548,000 | -4.20 | $549,000 | 12-Sep-2019 | 2017 | 03-Oct-2019 | 457 | $1,148 | Renovated/updated. |
| 407 3575 EUCLID AVENUE | $488,000 | $531,000 | -8.10 | $528,000 | 01-Apr-2019 | 2005 | 03-Oct-2019 | 678 | $719 | |
| 314 1177 HORNBY STREET | $557,500 | $542,000 | 2.86 | $569,900 | 30-Sep-2019 | 1994 | 03-Oct-2019 | 706 | $789 | Renovated/updated. |
| 1806 821 CAMBIE STREET | $840,000 | $1,066,000 | -21.20 | $879,900 | 30-Sep-2019 | 2008 | 03-Oct-2019 | 885 | $949 | |
| 1706 1308 HORNBY STREET | $750,000 | $764,000 | -1.83 | $838,000 | 18-Sep-2018 | 2014 | 03-Oct-2019 | 655 | $1,145 | |
| 213 3551 FOSTER AVENUE | $625,000 | $669,000 | -6.58 | $698,000 | 18-Jun-2019 | 2007 | 03-Oct-2019 | 895 | $698 | |
| 410 189 ONTARIO PLACE | $399,800 | $457,000 | -12.52 | $425,000 | 31-Jul-2019 | 2003 | 03-Oct-2019 | 532 | $751 | |
| 402 33 W PENDER STREET | $605,000 | $650,000 | -6.92 | $738,000 | 12-Nov-2018 | 2009 | 03-Oct-2019 | 780 | $775 | |
| 102 2829 ASH STREET | $640,000 | $786,000 | -18.58 | $839,900 | 11-Mar-2019 | 1993 | 03-Oct-2019 | 984 | $650 | Renovated/updated. |
| 130 2390 MCGILL STREET | $315,000 | $330,900 | -4.81 | $600,000 | 29-Nov-2017 | 1982 | 03-Oct-2019 | 652 | $483 | |
| 310 688 E 19TH AVENUE | $595,000 | $654,000 | -9.02 | $649,000 | 03-Sep-2019 | 2017 | 04-Oct-2019 | 693 | $858 | |
| 1503 977 MAINLAND STREET | $607,000 | $644,000 | -5.75 | $629,000 | 23-Sep-2019 | 2006 | 04-Oct-2019 | 510 | $1,190 | Renovated/updated. |
| 1007 933 SEYMOUR STREET | $685,000 | $608,000 | 12.66 | $748,000 | 05-Sep-2018 | 1998 | 04-Oct-2019 | 639 | $1,071 | Renovated/updated. |
| 223 159 W 2ND AVENUE | $575,000 | $599,000 | -4.01 | $629,000 | 19-Mar-2019 | 2017 | 04-Oct-2019 | 524 | $1,097 | |
| 104 8622 SELKIRK STREET | $485,000 | $418,800 | 15.81 | $539,000 | 25-Jun-2019 | 1956 | 04-Oct-2019 | 896 | $541 | Renovated/updated. |
| 1503 1189 HOWE STREET | $528,000 | $552,000 | -4.35 | $559,000 | 12-Jun-2019 | 1998 | 04-Oct-2019 | 540 | $977 | |
| 103 930 E 7TH AVENUE | $534,888 | $669,800 | -20.14 | $534,888 | 10-Sep-2019 | 1974 | 04-Oct-2019 | 865 | $618 | Renovated/updated. |
| 419 22 E CORDOVA STREET | $525,000 | $556,000 | -5.58 | $539,900 | 22-Sep-2019 | 1996 | 04-Oct-2019 | 568 | $924 | |
| 419 288 E 8TH AVENUE | $597,500 | $643,000 | -7.08 | $615,000 | 23-Sep-2019 | 1996 | 04-Oct-2019 | 779 | $767 | |
| 101 3 N GARDEN DRIVE | $476,000 | $462,000 | 3.03 | $492,000 | 19-Sep-2019 | 1994 | 04-Oct-2019 | 596 | $798 | Renovated/updated. |
| 424 2288 W BROADWAY | $925,000 | $1,006,000 | -8.05 | $899,000 | 23-Sep-2019 | 2008 | 04-Oct-2019 | 912 | $1,014 | |
| 108 6677 CAMBIE STREET | $720,000 | $747,000 | -3.61 | $789,000 | 26-Aug-2019 | 2016 | 04-Oct-2019 | 723 | $995 | |
| 1004 1199 SEYMOUR STREET | $1,025,000 | $1,035,000 | -0.97 | $1,049,000 | 01-Oct-2019 | 2005 | 04-Oct-2019 | 880 | $1,164 | |
| 2602 837 W HASTINGS STREET | $2,400,000 | $2,604,000 | -7.83 | $2,750,000 | 12-Aug-2019 | 1998 | 04-Oct-2019 | 1,966 | $1,220 | |
| 606 1708 COLUMBIA STREET | $632,500 | $674,000 | -6.16 | $668,000 | 19-Aug-2019 | 2013 | 04-Oct-2019 | 529 | $1,195 | |
| 303 621 E 6TH AVENUE | $607,500 | $604,700 | 0.46 | $624,800 | 16-Sep-2019 | 1974 | 04-Oct-2019 | 675 | $900 | Renovated/updated. |
| 315 2150 E HASTINGS STREET | $565,000 | $571,000 | -1.05 | $629,900 | 09-Sep-2019 | 2009 | 05-Oct-2019 | 700 | $807 | |
| 1202 1010 RICHARDS STREET | $661,000 | $694,000 | -4.76 | $658,800 | 03-Oct-2019 | 2003 | 05-Oct-2019 | 571 | $1,157 | |
| PH8 777 RICHARDS STREET | $2,750,000 | $3,301,000 | -16.69 | $2,998,000 | 17-Sep-2019 | 2016 | 05-Oct-2019 | 1,673 | $1,643 | |
| 705 811 HELMCKEN STREET | $555,000 | $594,000 | -6.57 | $599,000 | 08-Jul-2019 | 1994 | 05-Oct-2019 | 587 | $945 | Renovated/updated. |
| 802 1633 W 10TH AVENUE | $1,650,000 | $1,596,000 | 3.38 | $1,689,000 | 25-Sep-2019 | 1990 | 05-Oct-2019 | 1,612 | $1,023 | Renovated/updated. |
| 305 933 E HASTINGS STREET | $465,000 | $455,000 | 2.20 | $474,900 | 09-Sep-2019 | 2018 | 05-Oct-2019 | 501 | $928 | |
| 202 1088 RICHARDS STREET | $612,000 | $638,000 | -4.08 | $618,000 | 10-Sep-2019 | 2011 | 05-Oct-2019 | 572 | $1,069 | |
| 1008 1367 ALBERNI STREET | $620,000 | $659,000 | -5.92 | $680,000 | 05-Sep-2019 | 1999 | 05-Oct-2019 | 616 | $1,006 | |
| 318 2118 W 15TH AVENUE | $1,618,000 | $1,555,000 | 4.05 | $1,648,000 | 30-Sep-2019 | 2015 | 05-Oct-2019 | 1,210 | $1,337 | |
| 502 250 E 6TH AVENUE | $631,000 | $636,000 | -0.79 | $648,900 | 23-Sep-2019 | 2012 | 05-Oct-2019 | 640 | $985 | |
| 1701 1788 COLUMBIA STREET | $830,000 | $894,000 | -7.16 | $935,000 | 25-Mar-2019 | 2017 | 05-Oct-2019 | 729 | $1,138 | |
| 207 2137 W 10TH AVENUE | $1,350,000 | $1,437,000 | -6.05 | $1,488,000 | 03-Apr-2018 | 2004 | 05-Oct-2019 | 1,240 | $1,088 | Renovated/updated. |
| 506 1690 W 8TH AVENUE | $1,170,000 | $1,161,000 | 0.78 | $1,198,900 | 10-Jun-2019 | 2008 | 06-Oct-2019 | 1,070 | $1,093 | |
| 305 6633 CAMBIE STREET | $1,080,000 | $1,084,000 | -0.37 | $1,250,000 | 31-Jul-2019 | 2016 | 06-Oct-2019 | 1,075 | $1,004 | |
| 1204 983 E HASTINGS STREET | $590,000 | $633,000 | -6.79 | $595,000 | 30-Sep-2019 | 2018 | 06-Oct-2019 | 632 | $933 | Renovated/updated. |
| 206 1239 KINGSWAY | $510,000 | $525,000 | -2.86 | $549,000 | 18-Jun-2019 | 2010 | 06-Oct-2019 | 778 | $655 | |
| 309 1350 COMOX STREET | $515,000 | $518,500 | -0.68 | $559,000 | 12-Aug-2019 | 1982 | 06-Oct-2019 | 603 | $854 | Renovated/updated. |
| PH2 983 E HASTINGS STREET | $770,000 | $780,000 | -1.28 | $799,000 | 09-Sep-2019 | 2018 | 06-Oct-2019 | 777 | $990 | |
| 2702 5665 BOUNDARY ROAD | $625,000 | $659,000 | -5.16 | $649,999 | 04-Sep-2019 | 2016 | 06-Oct-2019 | 677 | $923 | |
| 316 1922 W 7TH AVENUE | $930,000 | $1,004,000 | -7.37 | $935,000 | 02-Oct-2019 | 1982 | 06-Oct-2019 | 1,054 | $882 | Renovated/updated. |
| 309 1009 EXPO BOULEVARD | $632,500 | $635,000 | -0.39 | $675,000 | 03-Apr-2019 | 1997 | 06-Oct-2019 | 677 | $934 | |
| 303 288 E 14TH AVENUE | $424,000 | $438,000 | -3.20 | $454,000 | 17-Jul-2018 | 1983 | 06-Oct-2019 | 463 | $915 | |
| 514 4818 ELDORADO MEWS | $492,000 | $494,000 | -0.40 | $533,000 | 07-Feb-2019 | 2013 | 06-Oct-2019 | 530 | $928 | |
| 120 3769 W 7TH AVENUE | $1,440,000 | $1,529,000 | -5.82 | $4,250 | 06-Jun-2019 | 1989 | 06-Oct-2019 | 1,573 | $915 | Renovated/updated. |
| 207 188 E 33RD AVENUE | $535,000 | $551,000 | -2.90 | $548,000 | 06-Aug-2019 | 1997 | 06-Oct-2019 | 691 | $774 | |
| 2206 438 SEYMOUR STREET | $490,000 | $547,000 | -10.42 | $498,000 | 11-Sep-2019 | 1996 | 06-Oct-2019 | 513 | $955 | |
| 501 189 NATIONAL AVENUE | $815,000 | $914,000 | -10.83 | $845,000 | 29-Jul-2019 | 2005 | 07-Oct-2019 | 976 | $835 | |
| 106 1477 FOUNTAIN WAY | $500,000 | $516,000 | -3.10 | $525,000 | 08-Jul-2019 | 1982 | 07-Oct-2019 | 920 | $543 | |
| 210 8988 HUDSON STREET | $505,000 | $531,000 | -4.90 | $524,900 | 30-Sep-2019 | 2004 | 07-Oct-2019 | 708 | $713 | |
| 212 838 HAMILTON STREET | $178,008 | $118,400 | 50.34 | $178,000 | 01-Oct-2019 | 1995 | 07-Oct-2019 | 317 | $561 | |
| 1402 1708 COLUMBIA STREET | $632,000 | $745,000 | -15.17 | $699,000 | 06-Mar-2019 | 2013 | 07-Oct-2019 | 547 | $1,155 | |
| 601 1200 ALBERNI STREET | $755,000 | $701,000 | 7.70 | $768,000 | 03-Jun-2019 | 1996 | 07-Oct-2019 | 752 | $1,003 | |
| 406 2770 SOPHIA STREET | $749,500 | $750,000 | -0.07 | $799,000 | 01-Sep-2019 | 2008 | 07-Oct-2019 | 813 | $921 | |
| 810 68 SMITHE STREET | $980,000 | $1,062,000 | -7.72 | $998,000 | 13-Sep-2019 | 2016 | 07-Oct-2019 | 936 | $1,047 | |
| 1206 588 BROUGHTON STREET | $735,000 | $820,000 | -10.37 | $888,000 | 16-Jan-2019 | 1995 | 07-Oct-2019 | 667 | $1,101 | Renovated/updated. |
| 1701 212 DAVIE STREET | $1,099,000 | $1,215,000 | -9.55 | $1,288,000 | 29-Aug-2019 | 1994 | 07-Oct-2019 | 1,260 | $872 | |
| 402 2370 W 2ND AVENUE | $488,800 | $490,000 | -0.24 | $499,000 | 24-Sep-2019 | 1967 | 07-Oct-2019 | 643 | $760 | Renovated/updated. |
| PH9 1838 RENFREW STREET | $450,000 | $498,000 | -9.64 | $488,000 | 27-Aug-2019 | 2017 | 07-Oct-2019 | 538 | $836 | |
| 2507 950 CAMBIE STREET | $998,200 | $1,064,000 | -6.18 | $1,099,900 | 16-Jul-2019 | 1993 | 07-Oct-2019 | 1,160 | $860 | Renovated/updated. |
| 106 1864 FRANCES STREET | $385,000 | $348,900 | 10.35 | $399,000 | 02-Oct-2019 | 1981 | 07-Oct-2019 | 569 | $676 | |
| 101 1195 W 8TH AVENUE | $509,000 | $467,000 | 8.99 | $569,000 | 06-Mar-2019 | 1996 | 07-Oct-2019 | 607 | $838 | Renovated/updated. |
| 806 819 HAMILTON STREET | $575,000 | $662,000 | -13.14 | $589,900 | 15-Jul-2019 | 1998 | 07-Oct-2019 | 563 | $1,021 | |
| 2005 5470 ORMIDALE STREET | $522,000 | $587,000 | -11.07 | $550,000 | 11-Jun-2019 | 2018 | 07-Oct-2019 | 579 | $901 | |
| 211 4818 ELDORADO MEWS | $475,000 | $465,000 | 2.15 | $485,000 | 25-Sep-2019 | 2013 | 07-Oct-2019 | 534 | $889 | |
| 102 1740 COMOX STREET | $535,000 | $539,000 | -0.74 | $575,000 | 19-Mar-2019 | 1976 | 07-Oct-2019 | 630 | $849 | |
| 2701 1308 HORNBY STREET | $1,200,000 | $1,306,000 | -8.12 | $1,350,000 | 30-Jul-2019 | 2014 | 08-Oct-2019 | 935 | $1,283 | |
| 2210 939 EXPO BOULEVARD | $735,000 | $763,000 | -3.67 | $749,900 | 11-Jul-2019 | 2005 | 08-Oct-2019 | 675 | $1,088 | |
| 109 950 DRAKE STREET | $432,000 | $488,000 | -11.48 | $425,000 | 12-Dec-2016 | 1982 | 08-Oct-2019 | 436 | $990 | |
| 510 5687 GRAY AVENUE | $1,150,000 | $944,000 | 21.82 | $1,420,000 | 01-Apr-2019 | 2018 | 08-Oct-2019 | 936 | $1,228 | |
| 401 1176 W 6TH AVENUE | $783,750 | $764,000 | 2.59 | $828,000 | 08-Sep-2019 | 1988 | 08-Oct-2019 | 753 | $1,040 | Renovated/updated. |
| 803 3663 CROWLEY DRIVE | $595,000 | $644,000 | -7.61 | $659,000 | 22-Jul-2019 | 2005 | 08-Oct-2019 | 882 | $674 | |
| 405 6018 IONA DRIVE | $649,000 | $670,000 | -3.13 | $649,000 | 05-Oct-2019 | 2006 | 08-Oct-2019 | 673 | $964 | |
| 16 1388 W 6TH AVENUE | $750,000 | $786,000 | -4.58 | $699,900 | 07-Oct-2019 | 1993 | 08-Oct-2019 | 850 | $882 | Renovated/updated. |
| 203 1275 HAMILTON STREET | $700,000 | $766,000 | -8.62 | $769,900 | 15-Jul-2019 | 2002 | 08-Oct-2019 | 676 | $1,035 | |
| 2302 1166 MELVILLE STREET | $643,000 | $684,000 | -5.99 | $649,000 | 23-Sep-2019 | 1997 | 08-Oct-2019 | 506 | $1,270 | |
| 807 2788 PRINCE EDWARD STREET | $935,000 | $1,077,000 | -13.18 | $988,000 | 03-Sep-2019 | 2013 | 08-Oct-2019 | 945 | $989 | |
| 301 1128 QUEBEC STREET | $999,000 | $1,006,000 | -0.70 | $1,058,000 | 03-Sep-2019 | 1994 | 08-Oct-2019 | 1,182 | $845 | Renovated/updated. |
| 721 W 7TH AVENUE | $620,000 | $619,300 | 0.11 | $595,000 | 01-Oct-2019 | 1988 | 08-Oct-2019 | 694 | $893 | |
| 607 289 ALEXANDER STREET | $700,000 | $822,000 | -14.84 | $849,800 | 08-Apr-2019 | 1999 | 08-Oct-2019 | 832 | $841 | |
| 109 1450 PENNYFARTHING DRIVE | $890,000 | $1,048,000 | -15.08 | $998,000 | 09-Sep-2019 | 1983 | 08-Oct-2019 | 1,242 | $716 | Renovated/updated. |
| 504 5350 BALSAM STREET | $585,000 | $730,000 | -19.86 | $699,000 | 11-Sep-2019 | 1973 | 08-Oct-2019 | 922 | $634 | Renovated/updated. |
| 311 930 E 7TH AVENUE | $660,000 | $753,100 | -12.36 | $649,000 | 02-Oct-2019 | 1974 | 08-Oct-2019 | 905 | $729 | Renovated/updated. |
| 1108 8588 CORNISH STREET | $853,000 | $957,000 | -10.87 | $957,000 | 22-Jul-2019 | 2014 | 08-Oct-2019 | 842 | $1,013 | |
| 1109 1028 BARCLAY STREET | $872,500 | $893,000 | -2.30 | $938,000 | 03-Jun-2019 | 2011 | 08-Oct-2019 | 795 | $1,097 | |
| 3007 188 KEEFER PLACE | $828,000 | $938,000 | -11.73 | $859,999 | 02-Oct-2019 | 2009 | 08-Oct-2019 | 840 | $985 | |
| 911 1212 HOWE STREET | $550,000 | $605,000 | -9.09 | $548,000 | 28-Sep-2019 | 2008 | 08-Oct-2019 | 530 | $1,037 | |
| 1205 867 HAMILTON STREET | $884,000 | $974,000 | -9.24 | $899,000 | 09-Sep-2019 | 1994 | 08-Oct-2019 | 1,038 | $851 | Renovated/updated. |
| 803 1690 W 8TH AVENUE | $704,000 | $853,000 | -17.47 | $699,000 | 30-Sep-2019 | 2008 | 08-Oct-2019 | 678 | $1,038 | |
| 1708 33 SMITHE STREET | $732,500 | $779,000 | -5.97 | $738,888 | 12-Sep-2019 | 2008 | 08-Oct-2019 | 705 | $1,039 | Renovated/updated. |
| 1005 1133 HOMER STREET | $990,000 | $994,000 | -0.40 | $998,800 | 07-Oct-2019 | 2008 | 09-Oct-2019 | 903 | $1,096 | |
| 369 8025 CHAMPLAIN CRESCENT | $550,000 | $534,000 | 3.00 | $560,000 | 15-Jan-2019 | 1983 | 09-Oct-2019 | 1,128 | $487 | Renovated/updated. |
| 908 38 W 1ST AVENUE | $1,050,000 | $1,054,000 | -0.38 | $1,069,000 | 17-Jul-2019 | 2015 | 09-Oct-2019 | 914 | $1,148 | |
| 205 3228 TUPPER STREET | $671,000 | $742,000 | -9.57 | $698,800 | 20-Sep-2019 | 2006 | 09-Oct-2019 | 703 | $954 | |
| 2504 999 SEYMOUR STREET | $1,375,000 | $1,363,000 | 0.88 | $1,588,000 | 20-Mar-2019 | 2014 | 09-Oct-2019 | 1,068 | $1,287 | |
| 1703 1128 QUEBEC STREET | $790,000 | $923,000 | -14.41 | $899,900 | 28-Aug-2019 | 1994 | 09-Oct-2019 | 978 | $807 | Renovated/updated. |
| 301 1788 ONTARIO STREET | $1,042,000 | $1,201,000 | -13.24 | $1,175,000 | 04-Sep-2019 | 2016 | 10-Oct-2019 | 955 | $1,091 | |
| B1101 1331 HOMER STREET | $685,000 | $761,000 | -9.99 | $699,000 | 23-Sep-2019 | 1989 | 10-Oct-2019 | 808 | $847 | Renovated/updated. |
| 506 6677 CAMBIE STREET | $890,000 | $891,000 | -0.11 | $975,000 | 27-Aug-2019 | 2016 | 10-Oct-2019 | 840 | $1,059 | |
| 501 2288 W 40TH AVENUE | $1,350,000 | $1,580,000 | -14.56 | $1,398,000 | 07-Oct-2019 | 1991 | 10-Oct-2019 | 1,587 | $850 | |
| 1109 1889 ALBERNI STREET | $515,000 | $509,000 | 1.18 | $639,900 | 16-Mar-2018 | 1998 | 10-Oct-2019 | 438 | $1,175 | |
| 409 1333 W GEORGIA STREET | $882,000 | $878,000 | 0.46 | $928,000 | 18-Jan-2019 | 2006 | 10-Oct-2019 | 947 | $931 | |
| 214 930 E 7TH AVENUE | $589,000 | $622,300 | -5.35 | $599,000 | 10-Sep-2019 | 1974 | 10-Oct-2019 | 838 | $702 | Renovated/updated. |
| 2602 1408 STRATHMORE MEWS | $1,475,000 | $1,732,000 | -14.84 | $1,598,000 | 29-Jul-2019 | 2002 | 10-Oct-2019 | 981 | $1,503 | Renovated/updated. |
| 2052 38 SMITHE STREET | $735,000 | $848,000 | -13.33 | $788,000 | 22-Jul-2019 | 2016 | 10-Oct-2019 | 610 | $1,204 | |
| 705 298 E 11TH AVENUE | $658,000 | $696,000 | -5.46 | $678,900 | 08-Oct-2019 | 2008 | 10-Oct-2019 | 711 | $925 | |
| 1215 1333 W GEORGIA STREET | $742,000 | $788,000 | -5.84 | $847,000 | 03-Sep-2019 | 2006 | 10-Oct-2019 | 770 | $963 | |
| 1201 728 W 8TH AVENUE | $820,000 | $780,000 | 5.13 | $849,000 | 12-Aug-2019 | 2012 | 11-Oct-2019 | 793 | $1,034 | |
| 1002 689 ABBOTT STREET | $840,000 | $900,000 | -6.67 | $845,000 | 24-Sep-2019 | 2009 | 11-Oct-2019 | 933 | $900 | |
| 103 2250 SE MARINE DRIVE | $557,000 | $514,000 | 8.37 | $648,000 | 10-Sep-2018 | 1989 | 11-Oct-2019 | 1,259 | $442 | Renovated/updated. |
| 810 168 W 1ST AVENUE | $695,000 | $775,000 | -10.32 | $699,000 | 30-Sep-2019 | 2013 | 11-Oct-2019 | 625 | $1,112 | |
| 215 3400 SE MARINE DRIVE | $480,000 | $475,000 | 1.05 | $499,000 | 28-Jul-2019 | 1992 | 11-Oct-2019 | 977 | $491 | |
| 705 1133 HORNBY STREET | $568,000 | $607,000 | -6.43 | $665,000 | 11-Jun-2018 | 2017 | 11-Oct-2019 | 533 | $1,065 | |
| 305 3028 ARBUTUS STREET | $820,000 | $821,000 | -0.12 | $833,000 | 04-Feb-2019 | 2014 | 11-Oct-2019 | 769 | $1,066 | |
| 506 590 NICOLA STREET | $1,355,000 | $1,474,000 | -8.07 | $1,688,890 | 13-Nov-2018 | 2003 | 11-Oct-2019 | 1,135 | $1,193 | |
| 2003 1088 QUEBEC STREET | $848,000 | $860,000 | -1.40 | $855,000 | 08-Oct-2019 | 1997 | 11-Oct-2019 | 959 | $884 | |
| 2703 1351 CONTINENTAL STREET | $708,000 | $729,000 | -2.88 | $735,000 | 30-Jul-2019 | 2013 | 11-Oct-2019 | 534 | $1,325 | |
| 219 288 E 8TH AVENUE | $595,000 | $598,000 | -0.50 | $699,000 | 17-Sep-2018 | 1996 | 11-Oct-2019 | 755 | $788 | |
| 401 821 CAMBIE STREET | $922,000 | $970,000 | -4.95 | $1,098,000 | 26-Mar-2019 | 2008 | 11-Oct-2019 | 902 | $1,022 | Renovated/updated. |
| 602 5850 BALSAM STREET | $1,325,000 | $1,777,000 | -25.44 | $1,999,000 | 17-Mar-2018 | 1991 | 12-Oct-2019 | 1,605 | $825 | |
| 5401 1128 W GEORGIA STREET | $5,050,000 | $5,500,000 | -8.18 | $5,988,000 | 24-Apr-2018 | 2008 | 12-Oct-2019 | 2,519 | $2,004 | |
| 220 3133 RIVERWALK AVENUE | $640,000 | $667,000 | -4.05 | $658,000 | 02-Oct-2019 | 2013 | 12-Oct-2019 | 865 | $739 | |
| 2209 8189 CAMBIE STREET | $572,000 | $641,000 | -10.76 | $598,000 | 30-Sep-2019 | 2017 | 12-Oct-2019 | 483 | $1,184 | |
| 2510 939 EXPO BOULEVARD | $755,000 | $775,000 | -2.58 | $769,900 | 23-Sep-2019 | 2005 | 12-Oct-2019 | 682 | $1,107 | Renovated/updated. |
| 203 1545 W 13TH AVENUE | $510,000 | $531,100 | -3.97 | $499,900 | 07-Oct-2019 | 1985 | 12-Oct-2019 | 643 | $793 | |
| 616 5470 ORMIDALE STREET | $508,000 | $515,000 | -1.36 | $513,000 | 09-Oct-2019 | 2018 | 12-Oct-2019 | 573 | $886 | |
| 201 921 THURLOW STREET | $515,000 | $636,000 | -19.03 | $525,000 | 07-Oct-2019 | 1987 | 12-Oct-2019 | 612 | $841 | Renovated/updated. |
| 101 2020 TRAFALGAR STREET | $492,500 | $481,000 | 2.39 | $599,800 | 16-May-2019 | 1989 | 13-Oct-2019 | 679 | $725 | Renovated/updated. |
| 404 1252 HORNBY STREET | $750,000 | $788,000 | -4.82 | $778,000 | 11-Sep-2019 | 2008 | 13-Oct-2019 | 799 | $938 | |
| 1906 1067 MARINASIDE CRESCENT | $885,000 | $1,001,000 | -11.59 | $949,900 | 21-May-2019 | 2002 | 13-Oct-2019 | 761 | $1,162 | Renovated/updated. |
| 359 108 W 1ST AVENUE | $907,000 | $984,000 | -7.83 | $938,800 | 07-Oct-2019 | 2013 | 13-Oct-2019 | 805 | $1,126 | |
| 312 621 E 6TH AVENUE | $560,000 | $555,900 | 0.74 | $559,000 | 08-Oct-2019 | 1974 | 13-Oct-2019 | 675 | $829 | Renovated/updated. |
| 1303 1155 HOMER STREET | $725,000 | $703,000 | 3.13 | $740,000 | 11-Oct-2019 | 1994 | 13-Oct-2019 | 692 | $1,047 | |
| 703 1252 HORNBY STREET | $599,000 | $635,000 | -5.67 | $599,000 | 01-Oct-2019 | 2008 | 13-Oct-2019 | 559 | $1,071 | |
| 124 3440 W BROADWAY | $737,500 | $703,000 | 4.91 | $769,000 | 18-Sep-2019 | 1993 | 13-Oct-2019 | 1,004 | $734 | |
| 710 68 SMITHE STREET | $988,000 | $1,044,000 | -5.36 | $1,299,000 | 24-May-2018 | 2016 | 13-Oct-2019 | 924 | $1,069 | |
| 403 928 RICHARDS STREET | $575,000 | $614,000 | -6.35 | $599,900 | 10-Jul-2019 | 2000 | 13-Oct-2019 | 586 | $981 | |
| 503 1633 W 8TH AVENUE | $925,000 | $906,000 | 2.10 | $948,000 | 07-Oct-2019 | 1994 | 13-Oct-2019 | 1,035 | $893 | Renovated/updated. |
| 311 688 E 19TH AVENUE | $610,000 | $672,000 | -9.23 | $619,000 | 09-Oct-2019 | 2017 | 13-Oct-2019 | 712 | $856 | |
| 805 168 POWELL STREET | $525,000 | $614,000 | -14.50 | $548,000 | 06-Aug-2019 | 2009 | 13-Oct-2019 | 755 | $695 | |
| 411 1919 WYLIE STREET | $648,000 | $653,000 | -0.77 | $675,000 | 09-Sep-2019 | 2012 | 13-Oct-2019 | 615 | $1,053 | |
| 1204 928 HOMER STREET | $649,900 | $671,000 | -3.14 | $724,888 | 17-Sep-2018 | 2006 | 14-Oct-2019 | 557 | $1,166 | |
| 306 718 MAIN STREET | $625,000 | $690,000 | -9.42 | $719,000 | 27-Mar-2018 | 2009 | 14-Oct-2019 | 790 | $791 | |
| 108 774 GREAT NORTHERN WAY | $450,000 | $386,600 | 16.40 | $449,800 | 07-Oct-2019 | 1971 | 14-Oct-2019 | 619 | $726 | Renovated/updated. |
| 603 233 ABBOTT STREET | $660,000 | $685,000 | -3.65 | $689,000 | 30-Aug-2019 | 1911 | 14-Oct-2019 | 677 | $974 | Renovated/updated. |
| 423 1515 W 2ND AVENUE | $693,000 | $780,000 | -11.15 | $788,000 | 22-May-2019 | 1989 | 14-Oct-2019 | 870 | $796 | |
| 613 3289 RIVERWALK AVENUE | $895,000 | $990,000 | -9.60 | $1,060,000 | 25-Jun-2019 | 2018 | 14-Oct-2019 | 1,239 | $722 | |
| 2202 550 TAYLOR STREET | $850,000 | $797,000 | 6.65 | $899,000 | 16-Sep-2019 | 2005 | 14-Oct-2019 | 828 | $1,026 | Renovated/updated. |
| 411 1275 HAMILTON STREET | $940,000 | $972,000 | -3.29 | $1,075,000 | 05-Nov-2018 | 2002 | 14-Oct-2019 | 885 | $1,062 | |
| 4B 1403 BEACH AVENUE | $2,330,000 | $2,664,000 | -12.54 | $2,750,000 | 24-Jul-2019 | 1992 | 15-Oct-2019 | 1,817 | $1,282 | |
| 602 233 ABBOTT STREET | $520,000 | $481,000 | 8.11 | $548,000 | 16-Sep-2019 | 1911 | 15-Oct-2019 | 552 | $942 | |
| 202 1239 KINGSWAY | $522,000 | $525,000 | -0.57 | $515,000 | 11-Oct-2019 | 2010 | 15-Oct-2019 | 778 | $670 | |
| N402 628 W 13TH AVENUE | $1,620,000 | $1,623,000 | -0.18 | $1,599,000 | 07-Oct-2019 | 1991 | 15-Oct-2019 | 1,717 | $943 | |
| 518 1082 SEYMOUR STREET | $830,000 | $818,000 | 1.47 | $995,000 | 20-Jul-2018 | 2006 | 15-Oct-2019 | 890 | $932 | Renovated/updated. |
| 2805 1200 W GEORGIA STREET | $968,000 | $986,000 | -1.83 | $999,999 | 09-Oct-2019 | 1998 | 15-Oct-2019 | 871 | $1,111 | |
| 401 2320 W 40TH AVENUE | $670,000 | $649,000 | 3.24 | $698,000 | 23-Sep-2019 | 1979 | 16-Oct-2019 | 912 | $734 | |
| 411 2511 QUEBEC STREET | $575,000 | $622,000 | -7.56 | $649,000 | 11-Feb-2019 | 2011 | 16-Oct-2019 | 665 | $864 | |
| 1503 602 CITADEL PARADE | $825,000 | $783,000 | 5.36 | $998,000 | 07-Aug-2018 | 2007 | 16-Oct-2019 | 885 | $932 | |
| 2005 1001 HOMER STREET | $900,000 | $946,000 | -4.86 | $950,000 | 10-Sep-2019 | 2005 | 16-Oct-2019 | 787 | $1,143 | |
| 2102 888 HOMER STREET | $663,000 | $751,000 | -11.72 | $688,000 | 30-Sep-2019 | 2011 | 16-Oct-2019 | 555 | $1,194 | |
| 409 1355 HARWOOD STREET | $580,000 | $558,500 | 3.85 | $585,000 | 23-Sep-2019 | 1975 | 16-Oct-2019 | 655 | $885 | Renovated/updated. |
| 205 789 DRAKE STREET | $517,000 | $571,000 | -9.46 | $519,900 | 15-Oct-2019 | 1990 | 16-Oct-2019 | 583 | $886 | |
| 807 5189 GASTON STREET | $410,000 | $438,000 | -6.39 | $488,888 | 04-Sep-2018 | 1995 | 16-Oct-2019 | 554 | $740 | Renovated/updated. |
| 1502 1200 ALBERNI STREET | $960,000 | $940,000 | 2.13 | $998,800 | 04-Oct-2019 | 1996 | 17-Oct-2019 | 913 | $1,051 | |
| 104 1445 MARPOLE AVENUE | $470,000 | $442,900 | 6.12 | $499,000 | 12-Aug-2019 | 1973 | 17-Oct-2019 | 580 | $810 | Renovated/updated. |
| 413 1661 QUEBEC STREET | $765,000 | $777,000 | -1.54 | $749,000 | 05-Sep-2019 | 2017 | 17-Oct-2019 | 661 | $1,157 | |
| 328 2680 W 4TH AVENUE | $750,000 | $923,000 | -18.74 | $825,000 | 02-Jul-2019 | 1996 | 17-Oct-2019 | 1,007 | $744 | Renovated/updated. Foreclosure |
| 202 16 LAKEWOOD DRIVE | $394,000 | $336,500 | 17.09 | $439,900 | 11-May-2019 | 1981 | 17-Oct-2019 | 636 | $619 | Renovated/updated. |
| 3502 667 HOWE STREET | $2,555,000 | $2,980,000 | -14.26 | $3,325,000 | 11-May-2019 | 2012 | 17-Oct-2019 | 1,482 | $1,724 | |
| 1704 1710 BAYSHORE DRIVE | $1,615,000 | $1,795,000 | -10.03 | $1,899,900 | 25-Apr-2019 | 1997 | 17-Oct-2019 | 1,346 | $1,199 | Renovated/updated. |
| 501 38 W 1ST AVENUE | $649,000 | $662,000 | -1.96 | $649,000 | 16-Oct-2019 | 2015 | 17-Oct-2019 | 564 | $1,150 | |
| 213 2333 TRIUMPH STREET | $499,000 | $423,200 | 17.91 | $525,000 | 23-Sep-2019 | 1976 | 17-Oct-2019 | 669 | $745 | Renovated/updated. |
| 1702 183 KEEFER PLACE | $838,000 | $891,000 | -5.95 | $860,000 | 15-Oct-2019 | 1995 | 17-Oct-2019 | 966 | $867 | |
| 407 2768 CRANBERRY DRIVE | $850,000 | $896,000 | -5.13 | $899,900 | 14-Jun-2019 | 2000 | 17-Oct-2019 | 894 | $950 | |
| 330 2008 PINE STREET | $728,000 | $700,000 | 4.00 | $725,000 | 09-Oct-2019 | 2009 | 17-Oct-2019 | 678 | $1,073 | |
| 309 789 W 16TH AVENUE | $560,000 | $567,000 | -1.23 | $599,000 | 09-Oct-2019 | 1995 | 17-Oct-2019 | 694 | $806 | |
| 503 188 KEEFER PLACE | $835,000 | $855,000 | -2.34 | $839,000 | 15-Oct-2019 | 2009 | 18-Oct-2019 | 988 | $845 | |
| 302 288 E 8TH AVENUE | $522,500 | $533,000 | -1.97 | $549,000 | 25-Sep-2019 | 1996 | 18-Oct-2019 | 612 | $853 | |
| 204 1616 COLUMBIA STREET | $577,000 | $663,000 | -12.97 | $588,900 | 12-Sep-2019 | 2009 | 18-Oct-2019 | 487 | $1,184 | |
| 510 821 CAMBIE STREET | $649,800 | $655,000 | -0.79 | $649,800 | 16-Oct-2019 | 2008 | 18-Oct-2019 | 629 | $1,033 | |
| 1608 1133 HORNBY STREET | $718,000 | $819,000 | -12.33 | $738,000 | 06-Sep-2019 | 2017 | 18-Oct-2019 | 654 | $1,097 | |
| 712 5470 ORMIDALE STREET | $500,000 | $493,000 | 1.42 | $529,000 | 17-Jun-2019 | 2018 | 18-Oct-2019 | 545 | $917 | |
| 104 2741 E HASTINGS STREET | $388,000 | $347,000 | 11.82 | $388,000 | 01-Oct-2019 | 2002 | 18-Oct-2019 | 570 | $680 | |
| 708 111 E 1ST AVENUE | $1,005,000 | $1,087,000 | -7.54 | $999,000 | 15-Oct-2019 | 2016 | 18-Oct-2019 | 948 | $1,060 | |
| 105 1740 COMOX STREET | $600,000 | $586,000 | 2.39 | $749,900 | 05-Sep-2018 | 1976 | 18-Oct-2019 | 850 | $705 | |
| 907 1009 HARWOOD STREET | $650,000 | $648,000 | 0.31 | $699,900 | 03-Sep-2019 | 2014 | 18-Oct-2019 | 569 | $1,142 | |
| 403 5958 IONA DRIVE | $680,000 | $692,000 | -1.73 | $768,000 | 13-May-2019 | 2006 | 18-Oct-2019 | 715 | $951 | Renovated/updated. |
| 3007 1111 ALBERNI STREET | $955,000 | $916,000 | 4.26 | $982,000 | 02-Apr-2019 | 2008 | 18-Oct-2019 | 606 | $1,575 | Renovated/updated. |
| 201 170 ATHLETES WAY | $2,250,000 | $2,274,000 | -1.06 | $2,599,800 | 16-Apr-2019 | 2009 | 19-Oct-2019 | 1,778 | $1,265 | |
| 212 2102 W 38TH AVENUE | $533,000 | $542,000 | -1.66 | $599,000 | 11-Sep-2019 | 2000 | 19-Oct-2019 | 630 | $846 | Renovated/updated. |
| 906 1055 RICHARDS STREET | $1,025,000 | $1,000,000 | 2.50 | $1,088,000 | 17-Oct-2019 | 2009 | 19-Oct-2019 | 856 | $1,197 | |
| 102 683 E 27TH AVENUE | $628,000 | $539,000 | 16.51 | $599,000 | 15-Oct-2019 | 2012 | 19-Oct-2019 | 667 | $941 | |
| 1203 5665 BOUNDARY ROAD | $560,000 | $540,000 | 3.70 | $589,000 | 22-Jul-2019 | 2016 | 19-Oct-2019 | 602 | $930 | |
| 914 5470 ORMIDALE STREET | $565,000 | $556,000 | 1.62 | $648,000 | 28-May-2019 | 2018 | 19-Oct-2019 | 660 | $856 | |
| 606 5189 GASTON STREET | $455,000 | $458,000 | -0.66 | $539,000 | 07-Jan-2019 | 1995 | 19-Oct-2019 | 719 | $632 | |
| 1801 188 KEEFER STREET | $1,130,000 | $1,148,000 | -1.57 | $1,098,000 | 15-Oct-2019 | 2016 | 20-Oct-2019 | 932 | $1,212 | |
| 607 4101 YEW STREET | $725,000 | $674,000 | 7.57 | $898,000 | 01-May-2017 | 1974 | 20-Oct-2019 | 1,005 | $721 | |
| 701 1028 BARCLAY STREET | $580,500 | $645,000 | -10.00 | $625,000 | 19-Aug-2019 | 2011 | 20-Oct-2019 | 578 | $1,004 | |
| 410 909 MAINLAND STREET | $650,000 | $649,000 | 0.15 | $659,900 | 15-Oct-2019 | 2006 | 20-Oct-2019 | 638 | $1,018 | |
| 810 989 NELSON STREET | $490,000 | $475,000 | 3.16 | $525,000 | 10-Sep-2019 | 1957 | 20-Oct-2019 | 519 | $944 | Renovated/updated. |
| 103 1655 NELSON STREET | $680,000 | $721,000 | -5.69 | $699,900 | 25-Sep-2019 | 1971 | 20-Oct-2019 | 867 | $784 | Renovated/updated. |
| 2810 5665 BOUNDARY ROAD | $482,000 | $531,000 | -9.23 | $489,000 | 09-Oct-2019 | 2016 | 20-Oct-2019 | 479 | $1,006 | |
| 103 1075 W 13TH AVENUE | $574,800 | $648,000 | -11.30 | $668,000 | 16-Apr-2019 | 1973 | 20-Oct-2019 | 922 | $623 | Renovated/updated. |
| 309 1470 PENNYFARTHING DRIVE | $970,000 | $851,000 | 13.98 | $1,098,000 | 10-Jun-2019 | 1985 | 20-Oct-2019 | 1,055 | $919 | Renovated/updated. |
| 502 1488 HORNBY STREET | $1,000,000 | $1,080,000 | -7.41 | $1,188,000 | 09-Sep-2019 | 1994 | 20-Oct-2019 | 1,123 | $890 | |
| 421 1588 E HASTINGS STREET | $640,000 | $624,000 | 2.56 | $678,000 | 09-Sep-2019 | 2015 | 20-Oct-2019 | 691 | $926 | |
| 306 2910 ONTARIO STREET | $550,000 | $518,100 | 6.16 | $499,000 | 15-Oct-2019 | 1975 | 21-Oct-2019 | 682 | $806 | Renovated/updated. |
| 106 1940 BARCLAY STREET | $372,000 | $373,300 | -0.35 | $398,000 | 10-Sep-2019 | 1993 | 21-Oct-2019 | 388 | $958 | Renovated/updated. |
| 1603 928 BEATTY STREET | $611,000 | $611,000 | 0.00 | $599,900 | 16-Oct-2019 | 2005 | 21-Oct-2019 | 517 | $1,181 | |
| 3103 833 SEYMOUR STREET | $1,278,000 | $1,455,000 | -12.16 | $1,598,000 | 22-Jan-2018 | 2011 | 21-Oct-2019 | 1,081 | $1,182 | Renovated/updated. |
| 202 3638 VANNESS AVENUE | $449,000 | $439,000 | 2.28 | $463,000 | 15-Jul-2019 | 2005 | 21-Oct-2019 | 575 | $780 | |
| 403 5350 BALSAM STREET | $560,000 | $638,000 | -12.23 | $689,000 | 04-Jun-2019 | 1973 | 22-Oct-2019 | 866 | $646 | |
| 2705 388 DRAKE STREET | $1,230,000 | $1,547,000 | -20.49 | $998,000 | 14-Oct-2019 | 1995 | 22-Oct-2019 | 1,202 | $1,023 | Renovated/updated. |
| 603 501 PACIFIC STREET | $485,000 | $465,000 | 4.30 | $488,800 | 15-Oct-2019 | 1999 | 22-Oct-2019 | 409 | $1,185 | |
| 401 1575 W 10TH AVENUE | $712,000 | $624,000 | 14.10 | $729,000 | 10-Sep-2019 | 1998 | 22-Oct-2019 | 878 | $810 | Renovated/updated. |
| 206 1827 W 3RD AVENUE | $675,000 | $705,500 | -4.32 | $699,000 | 07-Oct-2019 | 1977 | 22-Oct-2019 | 852 | $792 | Renovated/updated. |
| 1001 2445 W 3RD AVENUE | $1,998,000 | $2,000,000 | -0.10 | $1,998,000 | 24-Sep-2019 | 1975 | 22-Oct-2019 | 1,906 | $1,048 | Renovated/updated. |
| 702 910 BEACH AVENUE | $385,000 | $417,000 | -7.67 | $399,000 | 15-Oct-2019 | 1997 | 22-Oct-2019 | 415 | $927 | |
| 409 1212 HOWE STREET | $725,000 | $801,000 | -9.49 | $748,000 | 10-Sep-2019 | 2008 | 23-Oct-2019 | 771 | $940 | |
| 210 5735 HAMPTON PLACE | $775,000 | $777,000 | -0.26 | $848,000 | 10-Sep-2019 | 1995 | 23-Oct-2019 | 1,080 | $717 | Renovated/updated. |
| 223 383 E 37TH AVENUE | $460,000 | $532,000 | -13.53 | $539,000 | 02-Sep-2019 | 1994 | 23-Oct-2019 | 783 | $587 | |
| 3505 488 SW MARINE DRIVE | $580,000 | $655,000 | -11.45 | $579,900 | 07-Oct-2019 | 2015 | 23-Oct-2019 | 494 | $1,174 | |
| 801 933 E HASTINGS STREET | $520,000 | $553,000 | -5.97 | $525,000 | 22-Oct-2019 | 2018 | 24-Oct-2019 | 564 | $921 | |
| 801 1515 HOMER MEWS | $4,750,000 | $5,419,000 | -12.35 | $4,997,000 | 01-Sep-2019 | 2005 | 24-Oct-2019 | 2,183 | $2,175 | Renovated/updated. |
| 406 1635 W 3RD AVENUE | $745,000 | $789,000 | -5.58 | $749,900 | 21-Oct-2019 | 2010 | 25-Oct-2019 | 767 | $971 | |
| 306 5598 ORMIDALE STREET | $544,000 | $557,000 | -2.33 | $539,000 | 23-Oct-2019 | 2016 | 25-Oct-2019 | 598 | $909 | |
| 202 688 E 18TH AVENUE | $672,000 | $691,000 | -2.75 | $699,000 | 26-Sep-2019 | 2015 | 26-Oct-2019 | 855 | $785 | |
| 2003 777 RICHARDS STREET | $665,000 | $758,000 | -12.27 | $788,000 | 16-Oct-2017 | 2016 | 26-Oct-2019 | 546 | $1,217 |
189 out of 249 sold below assessed with a median sold price of -4.81
Richmond
| Address | Sold Price | Assessed | % Δ | True List Price | True List Date | Year Built | Sold Date | Sqft | Price per sqft | Notes |
|---|---|---|---|---|---|---|---|---|---|---|
| 307 8080 CAMBIE ROAD | $500,000 | $539,000 | -7.24 | $618,000 | 22-Oct-2018 | 2008 | 02-Oct-2019 | 715 | $699 | |
| 901 6288 NO. 3 ROAD | $780,000 | $819,000 | -4.76 | $849,800 | 28-May-2019 | 2016 | 02-Oct-2019 | 926 | $842 | |
| 303 7788 ACKROYD ROAD | $650,000 | $747,000 | -12.99 | $798,000 | 01-Apr-2019 | 2015 | 02-Oct-2019 | 926 | $701 | |
| 324 8751 GENERAL CURRIE ROAD | $375,000 | $412,100 | -9.00 | $389,000 | 11-Sep-2019 | 1989 | 02-Oct-2019 | 705 | $531 | |
| 205 8580 GENERAL CURRIE ROAD | $493,000 | $579,000 | -14.85 | $508,800 | 17-Sep-2019 | 1991 | 02-Oct-2019 | 1,151 | $428 | |
| 612 8988 PATTERSON ROAD | $518,000 | $532,000 | -2.63 | $649,000 | 26-Sep-2018 | 2017 | 02-Oct-2019 | 533 | $971 | |
| 103 5800 ANDREWS ROAD | $635,000 | $669,000 | -5.08 | $636,000 | 27-Sep-2019 | 1997 | 02-Oct-2019 | 1,055 | $601 | |
| 512 5311 CEDARBRIDGE WAY | $680,000 | $692,000 | -1.73 | $699,900 | 12-Sep-2019 | 2016 | 02-Oct-2019 | 908 | $748 | |
| 111 5880 DOVER CRESCENT | $416,500 | $455,300 | -8.52 | $422,000 | 04-Sep-2019 | 1995 | 03-Oct-2019 | 673 | $618 | Renovated/updated. |
| 114 7431 BLUNDELL ROAD | $446,500 | $484,100 | -7.77 | $468,000 | 01-Oct-2019 | 1983 | 03-Oct-2019 | 969 | $460 | |
| 1707 5900 ALDERBRIDGE WAY | $618,000 | $647,000 | -4.48 | $666,000 | 04-Dec-2018 | 2008 | 03-Oct-2019 | 768 | $804 | |
| 313 9371 HEMLOCK DRIVE | $487,000 | $556,000 | -12.41 | $549,900 | 18-Jun-2019 | 2009 | 03-Oct-2019 | 667 | $730 | |
| 1506 3331 BROWN ROAD | $765,000 | $843,000 | -9.25 | $819,000 | 30-Sep-2019 | 2017 | 04-Oct-2019 | 917 | $834 | |
| 206 7760 MOFFATT ROAD | $320,000 | $355,700 | -10.04 | $365,000 | 09-Aug-2019 | 1987 | 04-Oct-2019 | 650 | $492 | |
| 121 7295 MOFFATT ROAD | $312,500 | $319,600 | -2.22 | $328,800 | 17-Sep-2019 | 1981 | 05-Oct-2019 | 664 | $470 | Renovated/updated. |
| 1315 5811 NO 3 ROAD | $699,000 | $741,000 | -5.67 | $798,000 | 21-Jan-2019 | 2007 | 05-Oct-2019 | 1,040 | $672 | |
| 507 9099 COOK ROAD | $540,000 | $520,700 | 3.71 | $595,800 | 13-May-2019 | 2015 | 05-Oct-2019 | 619 | $872 | |
| 1507 8100 SABA ROAD | $485,000 | $551,000 | -11.98 | $518,800 | 15-Sep-2019 | 2003 | 05-Oct-2019 | 676 | $717 | |
| 1203 5088 KWANTLEN STREET | $639,980 | $689,000 | -7.11 | $678,000 | 06-Mar-2019 | 2007 | 05-Oct-2019 | 836 | $765 | |
| 1108 8988 PATTERSON ROAD | $540,000 | $551,000 | -2.00 | $575,000 | 06-Aug-2019 | 2017 | 06-Oct-2019 | 533 | $1,013 | |
| 101 7071 BLUNDELL ROAD | $420,000 | $380,600 | 10.35 | $449,000 | 24-Sep-2019 | 1992 | 06-Oct-2019 | 722 | $581 | Renovated/updated. |
| 312 3233 KETCHESON ROAD | $679,000 | $754,000 | -9.95 | $746,000 | 18-Sep-2018 | 2018 | 06-Oct-2019 | 842 | $806 | |
| 1502 7488 LANSDOWNE ROAD | $742,000 | $777,000 | -4.50 | $758,000 | 21-Mar-2019 | 2017 | 06-Oct-2019 | 829 | $895 | |
| 409 4500 WESTWATER DRIVE | $580,000 | $698,000 | -16.91 | $599,000 | 14-Jul-2019 | 2004 | 06-Oct-2019 | 802 | $723 | |
| 1202 9099 COOK ROAD | $680,000 | $803,000 | -15.32 | $710,000 | 31-Jul-2019 | 2015 | 07-Oct-2019 | 868 | $783 | |
| 110 7480 ST. ALBANS ROAD | $445,000 | $411,000 | 8.27 | $490,000 | 17-Jun-2019 | 1991 | 07-Oct-2019 | 864 | $515 | Renovated/updated. |
| 902 7360 ELMBRIDGE WAY | $448,000 | $463,000 | -3.24 | $488,000 | 16-Sep-2019 | 2008 | 07-Oct-2019 | 595 | $752 | |
| 109 10155 RIVER DRIVE | $505,000 | $514,000 | -1.75 | $509,000 | 02-Oct-2019 | 2014 | 07-Oct-2019 | 761 | $663 | |
| 801 3131 KETCHESON ROAD | $649,000 | $659,000 | -1.52 | $689,000 | 20-Aug-2019 | 2016 | 07-Oct-2019 | 749 | $866 | |
| 108 5600 ANDREWS ROAD | $518,000 | $570,000 | -9.12 | $518,000 | 30-Sep-2019 | 1998 | 07-Oct-2019 | 856 | $605 | Renovated/updated. |
| 111 9300 GLENACRES DRIVE | $294,500 | $347,600 | -15.28 | $324,900 | 06-Aug-2019 | 1971 | 08-Oct-2019 | 728 | $404 | |
| 703 9133 HEMLOCK DRIVE | $670,000 | $697,000 | -3.87 | $699,000 | 28-Aug-2019 | 2004 | 08-Oct-2019 | 981 | $682 | |
| 510 3131 KETCHESON ROAD | $525,000 | $484,000 | 8.47 | $539,500 | 07-Aug-2019 | 2016 | 08-Oct-2019 | 525 | $1,000 | |
| 108 7671 ABERCROMBIE DRIVE | $570,000 | $756,000 | -24.60 | $685,800 | 04-Mar-2019 | 1986 | 08-Oct-2019 | 1,560 | $365 | Renovated/updated. |
| 320 8500 GENERAL CURRIE ROAD | $475,000 | $536,000 | -11.38 | $525,000 | 04-Jun-2019 | 1990 | 08-Oct-2019 | 1,070 | $443 | Renovated/updated. |
| 311 9399 ALEXANDRA ROAD | $681,500 | $712,000 | -4.28 | $709,900 | 30-Jul-2019 | 2015 | 09-Oct-2019 | 987 | $690 | |
| 503 7680 GRANVILLE AVENUE | $400,000 | $393,000 | 1.78 | $418,000 | 23-Sep-2019 | 1997 | 09-Oct-2019 | 633 | $631 | |
| 817 7988 ACKROYD ROAD | $668,000 | $736,000 | -9.24 | $679,000 | 02-Oct-2019 | 2013 | 09-Oct-2019 | 870 | $767 | |
| 702 5933 COONEY ROAD | $568,000 | $602,000 | -5.65 | $575,000 | 01-Oct-2019 | 2003 | 09-Oct-2019 | 854 | $665 | |
| 206 14300 RIVERPORT WAY | $515,000 | $615,000 | -16.26 | $559,900 | 10-Jun-2019 | 2006 | 09-Oct-2019 | 1,098 | $469 | |
| 107 8120 COLONIAL DRIVE | $356,000 | $303,200 | 17.41 | $369,000 | 16-Sep-2019 | 1977 | 10-Oct-2019 | 644 | $552 | Renovated/updated. |
| 323 5700 ANDREWS ROAD | $592,000 | $659,000 | -10.17 | $649,000 | 19-Jun-2019 | 2002 | 10-Oct-2019 | 908 | $651 | Renovated/updated. |
| 807 8288 GRANVILLE AVENUE | $690,000 | $736,000 | -6.25 | $778,000 | 29-Jul-2019 | 2015 | 11-Oct-2019 | 922 | $748 | |
| 108 6651 LYNAS LANE | $392,500 | $384,200 | 2.16 | $448,000 | 19-Jun-2019 | 1981 | 11-Oct-2019 | 927 | $423 | |
| 314 8740 NO. 1 ROAD | $374,000 | $451,600 | -17.18 | $379,000 | 20-Sep-2019 | 1973 | 12-Oct-2019 | 957 | $390 | |
| 205 8900 CITATION DRIVE | $280,000 | $335,200 | -16.47 | $328,000 | 03-Jun-2019 | 1980 | 12-Oct-2019 | 650 | $430 | |
| 111 9373 HEMLOCK DRIVE | $751,000 | $891,000 | -15.71 | $798,000 | 12-Aug-2019 | 2008 | 13-Oct-2019 | 1,139 | $659 | |
| 1007 5177 BRIGHOUSE WAY | $736,000 | $736,000 | 0.00 | $748,000 | 08-Oct-2019 | 2013 | 13-Oct-2019 | 812 | $906 | |
| 502 9188 COOK ROAD | $599,000 | $582,000 | 2.92 | $628,000 | 16-Sep-2019 | 2007 | 13-Oct-2019 | 822 | $728 | |
| 1505 8811 LANSDOWNE ROAD | $680,000 | $770,000 | -11.69 | $718,000 | 10-Sep-2019 | 1991 | 13-Oct-2019 | 1,260 | $539 | Renovated/updated. |
| 422 9200 FERNDALE ROAD | $508,000 | $592,000 | -14.19 | $618,000 | 03-Oct-2018 | 2006 | 14-Oct-2019 | 809 | $627 | |
| 301 7511 MINORU BOULEVARD | $440,000 | $483,300 | -8.96 | $458,000 | 08-Oct-2019 | 1983 | 14-Oct-2019 | 926 | $475 | Renovated/updated. |
| 1205 7080 NO 3 ROAD | $635,000 | $652,000 | -2.61 | $649,000 | 07-Oct-2019 | 2009 | 14-Oct-2019 | 920 | $690 | |
| 215 5500 LYNAS LANE | $540,000 | $627,000 | -13.88 | $598,000 | 29-Jan-2019 | 1995 | 14-Oct-2019 | 950 | $568 | |
| 206 7200 GILBERT ROAD | $475,000 | $488,000 | -2.66 | $465,000 | 08-Oct-2019 | 1988 | 15-Oct-2019 | 980 | $484 | Renovated/updated. |
| 523 5399 CEDARBRIDGE WAY | $650,000 | $698,000 | -6.88 | $699,000 | 14-Sep-2018 | 2015 | 15-Oct-2019 | 929 | $699 | |
| 309 10880 NO. 5 ROAD | $525,000 | $628,000 | -16.40 | $639,000 | 19-Jul-2018 | 2014 | 15-Oct-2019 | 883 | $594 | |
| 238 7439 MOFFATT ROAD | $572,000 | $543,000 | 5.34 | $676,000 | 10-Jun-2019 | 1990 | 15-Oct-2019 | 1,225 | $466 | Renovated/updated. |
| 207 6331 BUSWELL STREET | $438,000 | $482,000 | -9.13 | $465,000 | 08-Oct-2019 | 2003 | 16-Oct-2019 | 678 | $646 | |
| 306 6828 ECKERSLEY ROAD | $585,000 | $630,000 | -7.14 | $599,000 | 19-Sep-2019 | 2011 | 16-Oct-2019 | 891 | $656 | |
| 503 7788 ACKROYD ROAD | $738,000 | $761,000 | -3.02 | $838,000 | 01-Apr-2019 | 2015 | 17-Oct-2019 | 926 | $796 | |
| 1506 6971 ELMBRIDGE WAY | $480,000 | $513,000 | -6.43 | $509,800 | 15-May-2019 | 2014 | 17-Oct-2019 | 543 | $883 | |
| 220 8880 JONES ROAD | $418,000 | $540,000 | -22.59 | $448,000 | 12-Aug-2019 | 1993 | 18-Oct-2019 | 937 | $446 | |
| 1805 7788 ACKROYD ROAD | $755,000 | $901,000 | -16.20 | $899,000 | 26-Jun-2019 | 2015 | 19-Oct-2019 | 894 | $844 | |
| 1006 6951 ELMBRIDGE WAY | $488,800 | $464,000 | 5.34 | $499,900 | 16-Sep-2019 | 2014 | 21-Oct-2019 | 564 | $866 | Renovated/updated. |
54 out of 64 sold below assessed with a median sold price of -7.13
Burnaby
| Address | Sold Price | Assessed | % Δ | True List Price | True List Date | Year Built | Sold Date | Sqft | Price per sqft | Notes |
|---|---|---|---|---|---|---|---|---|---|---|
| 509 5460 BROADWAY | $649,001 | $673,000 | -3.57 | $649,000 | 06-Jun-2019 | 2018 | 02-Oct-2019 | 772 | $840 | |
| 1802 2077 ROSSER AVENUE | $864,500 | $913,000 | -5.31 | $868,000 | 01-Oct-2019 | 2013 | 02-Oct-2019 | 955 | $905 | |
| 801 6588 NELSON AVENUE | $563,000 | $568,000 | -0.88 | $589,000 | 20-Sep-2019 | 2015 | 02-Oct-2019 | 607 | $927 | |
| 1309 6333 SILVER AVENUE | $730,000 | $830,000 | -12.05 | $750,000 | 10-Sep-2019 | 2015 | 02-Oct-2019 | 890 | $820 | |
| 2610 9868 CAMERON STREET | $645,000 | $718,000 | -10.17 | $725,000 | 23-Apr-2019 | 2008 | 02-Oct-2019 | 955 | $675 | |
| 903 4425 HALIFAX STREET | $685,000 | $711,000 | -3.66 | $729,900 | 15-Sep-2019 | 1998 | 02-Oct-2019 | 989 | $692 | |
| 513 7138 COLLIER STREET | $552,000 | $608,000 | -9.21 | $549,988 | 01-Oct-2019 | 2005 | 02-Oct-2019 | 853 | $647 | |
| 505 3740 ALBERT STREET | $477,500 | $497,000 | -3.92 | $525,000 | 21-May-2019 | 1983 | 03-Oct-2019 | 900 | $530 | Renovated/updated. |
| 1105 5652 PATTERSON AVENUE | $490,000 | $479,000 | 2.30 | $499,900 | 25-Sep-2019 | 1981 | 03-Oct-2019 | 964 | $508 | |
| 505 4567 HAZEL STREET | $785,000 | $768,000 | 2.21 | $799,000 | 09-Sep-2019 | 1999 | 03-Oct-2019 | 1,222 | $642 | |
| 1203 2200 DOUGLAS ROAD | $760,000 | $860,000 | -11.63 | $789,000 | 23-Sep-2019 | 2011 | 03-Oct-2019 | 1,071 | $709 | |
| 2701 5611 GORING STREET | $937,000 | $1,039,000 | -9.82 | $968,000 | 28-Jan-2019 | 2008 | 04-Oct-2019 | 1,378 | $679 | |
| 1507 9633 MANCHESTER DRIVE | $410,000 | $510,000 | -19.61 | $539,000 | 26-Jul-2018 | 1993 | 04-Oct-2019 | 805 | $509 | Renovated/updated. |
| 1201 6595 WILLINGDON AVENUE | $448,000 | $504,000 | -11.11 | $499,000 | 03-Jun-2019 | 1982 | 04-Oct-2019 | 916 | $489 | Renovated/updated. |
| 203 4833 BRENTWOOD DRIVE | $500,000 | $585,000 | -14.53 | $558,888 | 16-May-2019 | 2008 | 06-Oct-2019 | 733 | $682 | |
| 203 6688 ARCOLA STREET | $577,000 | $590,000 | -2.20 | $598,000 | 20-May-2019 | 2011 | 06-Oct-2019 | 850 | $678 | |
| 3102 2008 ROSSER AVENUE | $905,000 | $1,006,000 | -10.04 | $1,148,000 | 19-Mar-2019 | 2015 | 06-Oct-2019 | 964 | $938 | |
| 2101 5885 OLIVE AVENUE | $728,000 | $735,000 | -0.95 | $728,000 | 05-Sep-2019 | 1990 | 06-Oct-2019 | 1,204 | $604 | |
| 2202 9868 CAMERON STREET | $602,000 | $710,000 | -15.21 | $599,000 | 26-Aug-2019 | 2008 | 06-Oct-2019 | 955 | $630 | |
| 305 9319 UNIVERSITY CRESCENT | $465,000 | $540,000 | -13.89 | $493,000 | 16-Sep-2019 | 2005 | 07-Oct-2019 | 963 | $482 | |
| 3307 6638 DUNBLANE AVENUE | $880,000 | $1,020,000 | -13.73 | $948,000 | 26-Aug-2019 | 2018 | 07-Oct-2019 | 922 | $954 | |
| 1203 7388 SANDBORNE AVENUE | $750,000 | $739,000 | 1.49 | $879,000 | 01-May-2019 | 2002 | 07-Oct-2019 | 1,095 | $684 | |
| 1706 4380 HALIFAX STREET | $645,000 | $653,000 | -1.23 | $859,000 | 23-Aug-2018 | 2004 | 07-Oct-2019 | 830 | $777 | Renovated/updated. |
| 1305 6659 SOUTHOAKS CRESCENT | $578,000 | $635,000 | -8.98 | $618,000 | 26-Mar-2019 | 2003 | 07-Oct-2019 | 901 | $641 | Renovated/updated. |
| 314 9847 MANCHESTER DRIVE | $395,000 | $314,300 | 25.68 | $410,000 | 12-Sep-2019 | 1980 | 07-Oct-2019 | 662 | $596 | Renovated/updated. |
| 1201 2232 DOUGLAS ROAD | $670,000 | $750,000 | -10.67 | $726,000 | 28-Aug-2019 | 2011 | 08-Oct-2019 | 899 | $745 | |
| 505 4105 IMPERIAL STREET | $385,000 | $418,000 | -7.89 | $489,000 | 05-Jun-2018 | 1976 | 08-Oct-2019 | 787 | $489 | |
| 1804 7368 SANDBORNE AVENUE | $655,000 | $812,000 | -19.33 | $799,000 | 26-Nov-2018 | 2002 | 08-Oct-2019 | 1,202 | $544 | |
| 302 6823 STATION HILL DRIVE | $585,000 | $607,000 | -3.62 | $616,000 | 16-Sep-2019 | 2007 | 08-Oct-2019 | 826 | $708 | |
| 603 9623 MANCHESTER DRIVE | $443,000 | $463,000 | -4.32 | $490,000 | 18-Jun-2019 | 1992 | 08-Oct-2019 | 808 | $548 | Renovated/updated. |
| 903 9188 UNIVERSITY CRESCENT | $675,000 | $696,000 | -3.02 | $699,000 | 29-Jul-2019 | 2008 | 08-Oct-2019 | 1,029 | $655 | |
| 1606 2077 ROSSER AVENUE | $868,000 | $899,000 | -3.45 | $849,000 | 07-Oct-2019 | 2013 | 08-Oct-2019 | 971 | $893 | |
| 1501 9521 CARDSTON COURT | $396,000 | $427,000 | -7.26 | $415,000 | 01-Sep-2019 | 1983 | 09-Oct-2019 | 805 | $491 | Renovated/updated. |
| 202 5388 GRIMMER STREET | $560,000 | $567,000 | -1.23 | $449,000 | 18-Jul-2016 | 2010 | 09-Oct-2019 | 830 | $674 | |
| 1206 7275 SALISBURY AVENUE | $430,000 | $455,100 | -5.52 | $468,000 | 05-Jun-2019 | 1981 | 09-Oct-2019 | 780 | $551 | |
| 402 4105 IMPERIAL STREET | $401,000 | $438,000 | -8.45 | $358,000 | 30-Sep-2019 | 1976 | 09-Oct-2019 | 803 | $499 | |
| 307 4160 SARDIS STREET | $460,000 | $448,000 | 2.68 | $478,000 | 05-Sep-2019 | 1975 | 10-Oct-2019 | 947 | $485 | Renovated/updated. |
| 3605 6588 NELSON AVENUE | $1,068,000 | $1,105,000 | -3.35 | $1,258,000 | 22-Mar-2019 | 2015 | 10-Oct-2019 | 1,096 | $974 | |
| 1202 9521 CARDSTON COURT | $465,000 | $451,000 | 3.10 | $500,000 | 16-Sep-2019 | 1983 | 10-Oct-2019 | 901 | $516 | Renovated/updated. |
| 502 9168 SLOPES MEWS | $600,000 | $691,000 | -13.17 | $675,000 | 04-Jul-2018 | 2017 | 10-Oct-2019 | 968 | $619 | |
| 210 9101 HORNE STREET | $320,000 | $378,600 | -15.48 | $320,000 | 08-Oct-2019 | 1975 | 10-Oct-2019 | 710 | $450 | Renovated/updated. |
| 1201 4808 HAZEL STREET | $520,000 | $581,000 | -10.50 | $538,800 | 21-Aug-2019 | 2008 | 10-Oct-2019 | 645 | $806 | |
| 316 9350 UNIVERSITY HIGH STREET | $360,000 | $373,000 | -3.49 | $369,000 | 30-Sep-2019 | 2013 | 11-Oct-2019 | 581 | $619 | |
| 205 5388 GRIMMER STREET | $557,500 | $567,000 | -1.68 | $615,000 | 06-Feb-2019 | 2010 | 11-Oct-2019 | 830 | $671 | |
| 602 6055 NELSON AVENUE | $610,000 | $632,000 | -3.48 | $630,000 | 13-May-2019 | 1988 | 11-Oct-2019 | 1,111 | $549 | Renovated/updated. |
| 318 3921 CARRIGAN COURT | $420,000 | $459,300 | -8.56 | $429,900 | 04-Sep-2019 | 1972 | 12-Oct-2019 | 919 | $457 | Renovated/updated. |
| 310 4788 BRENTWOOD DRIVE | $490,000 | $558,000 | -12.19 | $518,000 | 23-Aug-2019 | 2008 | 12-Oct-2019 | 709 | $691 | |
| 2109 6098 STATION STREET | $519,000 | $545,000 | -4.77 | $539,000 | 09-Sep-2019 | 2018 | 12-Oct-2019 | 512 | $1,013 | |
| 411 5460 BROADWAY | $647,000 | $712,000 | -9.13 | $679,000 | 13-Sep-2019 | 2018 | 13-Oct-2019 | 820 | $789 | |
| 1802 9888 CAMERON STREET | $598,000 | $697,000 | -14.20 | $624,900 | 08-Oct-2019 | 2008 | 13-Oct-2019 | 955 | $626 | |
| 103 6659 SOUTHOAKS CRESCENT | $490,000 | $530,000 | -7.55 | $500,000 | 01-Oct-2019 | 2003 | 13-Oct-2019 | 843 | $581 | |
| 2201 4353 HALIFAX STREET | $507,000 | $543,000 | -6.63 | $528,000 | 16-Sep-2019 | 1982 | 13-Oct-2019 | 917 | $552 | Renovated/updated. |
| 4301 4485 SKYLINE DRIVE | $995,000 | $953,000 | 4.41 | $1,100,000 | 18-Jul-2019 | 2017 | 14-Oct-2019 | 931 | $1,068 | |
| 805 5848 OLIVE AVENUE | $730,000 | $762,000 | -4.20 | $720,000 | 09-Oct-2019 | 1999 | 14-Oct-2019 | 1,158 | $630 | |
| 1208 6461 TELFORD AVENUE | $760,000 | $799,000 | -4.88 | $798,000 | 11-Mar-2019 | 2011 | 14-Oct-2019 | 828 | $917 | |
| 302 7418 BYRNEPARK WALK | $575,000 | $608,000 | -5.43 | $579,800 | 09-Oct-2019 | 2010 | 14-Oct-2019 | 787 | $730 | |
| 2303 5885 OLIVE AVENUE | $650,000 | $714,000 | -8.96 | $698,000 | 06-Aug-2019 | 1990 | 15-Oct-2019 | 1,161 | $559 | |
| 2201 3755 BARTLETT COURT | $447,500 | $460,000 | -2.72 | $619,900 | 28-Aug-2018 | 1976 | 15-Oct-2019 | 928 | $482 | Renovated/updated. |
| 209 9319 UNIVERSITY CRESCENT | $468,500 | $473,000 | -0.95 | $485,000 | 16-Sep-2019 | 2005 | 16-Oct-2019 | 836 | $560 | |
| 209 5889 IRMIN STREET | $571,250 | $639,000 | -10.60 | $599,000 | 22-Jul-2019 | 2009 | 17-Oct-2019 | 853 | $669 | |
| 1003 4888 BRENTWOOD DRIVE | $658,000 | $702,000 | -6.27 | $699,000 | 26-Apr-2019 | 2008 | 17-Oct-2019 | 919 | $715 | |
| 1204 6282 KATHLEEN AVENUE | $595,000 | $680,000 | -12.50 | $659,900 | 24-Jan-2019 | 1986 | 17-Oct-2019 | 1,171 | $508 | |
| 1506 6888 STATION HILL DRIVE | $648,000 | $668,000 | -2.99 | $698,000 | 09-Sep-2019 | 1991 | 18-Oct-2019 | 1,147 | $564 | |
| 204 3183 ESMOND AVENUE | $416,000 | $440,000 | -5.45 | $418,000 | 15-Oct-2019 | 1994 | 18-Oct-2019 | 715 | $581 | Renovated/updated. |
| 102 9847 MANCHESTER DRIVE | $380,000 | $437,500 | -13.14 | $398,000 | 19-Aug-2019 | 1980 | 18-Oct-2019 | 867 | $438 | |
| 10 5128 CANADA WAY | $362,000 | $355,000 | 1.97 | $385,000 | 13-Sep-2019 | 2018 | 18-Oct-2019 | 412 | $878 | |
| 321 4833 BRENTWOOD DRIVE | $585,000 | $626,000 | -6.55 | $593,800 | 16-Oct-2019 | 2008 | 20-Oct-2019 | 849 | $689 | |
| 1404 6689 WILLINGDON AVENUE | $378,000 | $430,500 | -12.20 | $409,000 | 02-Jul-2019 | 1975 | 20-Oct-2019 | 681 | $555 | Renovated/updated. |
| 106 6939 GILLEY AVENUE | $465,000 | $491,000 | -5.30 | $548,000 | 06-May-2019 | 1990 | 20-Oct-2019 | 924 | $503 | |
| 202 6860 RUMBLE STREET | $388,000 | $396,900 | -2.24 | $400,000 | 17-Oct-2019 | 1992 | 20-Oct-2019 | 743 | $522 | |
| 201 6595 WILLINGDON AVENUE | $425,000 | $470,000 | -9.57 | $425,000 | 16-Oct-2019 | 1982 | 21-Oct-2019 | 916 | $463 | |
| 301 5788 SIDLEY STREET | $578,000 | $618,000 | -6.47 | $599,800 | 12-Jun-2019 | 2012 | 21-Oct-2019 | 812 | $711 | |
| 511 5262 OAKMOUNT CRESCENT | $521,000 | $605,000 | -13.88 | $599,000 | 23-Oct-2018 | 1994 | 21-Oct-2019 | 1,023 | $509 | |
| 306 7337 MACPHERSON AVENUE | $590,000 | $622,000 | -5.14 | $649,000 | 11-Apr-2019 | 2008 | 21-Oct-2019 | 862 | $684 | |
| 906 6333 SILVER AVENUE | $518,000 | $532,000 | -2.63 | $518,000 | 07-Oct-2019 | 2015 | 27-Oct-2019 | 510 | $1,015 |
67 out of 75 sold below assessed with a median sold price of -5.52
West Vancouver
| Address | Sold Price | Assessed | % Δ | True List Price | True List Date | Year Built | Sold Date | Sqft | Price per sqft | Notes |
|---|---|---|---|---|---|---|---|---|---|---|
| 408 2119 BELLEVUE AVENUE | $508,000 | $558,400 | -9.03 | $582,000 | 29-Aug-2018 | 1978 | 06-Oct-2019 | 587 | $865 | |
| 1101 2280 BELLEVUE AVENUE | $3,800,000 | $3,930,000 | -3.31 | $5,180,000 | 18-Jun-2018 | 1989 | 09-Oct-2019 | 1,858 | $2,045 | Renovated/updated. |
| 301 1412 ESQUIMALT AVENUE | $750,000 | $710,000 | 5.63 | $799,000 | 24-Apr-2019 | 1975 | 18-Oct-2019 | 972 | $771 | Renovated/updated. |
| 502 1341 CLYDE AVENUE | $720,000 | $930,000 | -22.58 | $889,000 | 13-May-2019 | 1977 | 21-Oct-2019 | 952 | $756 | Renovated/updated. |
3 out of 4 sold below assessed with a median sold price of -6.17
New Westminster
| Address | Sold Price | Assessed | % Δ | True List Price | True List Date | Year Built | Sold Date | Sqft | Price per sqft | Notes |
|---|---|---|---|---|---|---|---|---|---|---|
| 403 14 BEGBIE STREET | $528,500 | $503,000 | 5.07 | $578,800 | 07-May-2018 | 2009 | 02-Oct-2019 | 850 | $621 | |
| 206 225 SIXTH STREET | $515,000 | $561,900 | -8.35 | $569,000 | 13-May-2019 | 1976 | 03-Oct-2019 | 1,250 | $412 | Renovated/updated. |
| 1607 14 BEGBIE STREET | $452,000 | $490,000 | -7.76 | $445,000 | 09-Sep-2019 | 2009 | 03-Oct-2019 | 662 | $682 | |
| 504 306 SIXTH STREET | $445,000 | $475,000 | -6.32 | $489,000 | 21-May-2019 | 2009 | 03-Oct-2019 | 685 | $649 | |
| 1306 188 AGNES STREET | $435,000 | $471,000 | -7.64 | $435,000 | 23-Sep-2019 | 2017 | 03-Oct-2019 | 577 | $753 | |
| 403 1135 QUAYSIDE DRIVE | $575,000 | $570,000 | 0.88 | $589,900 | 06-Aug-2019 | 1989 | 03-Oct-2019 | 1,141 | $503 | Renovated/updated. |
| 303 119 AGNES STREET | $316,600 | $304,600 | 3.94 | $379,999 | 09-Oct-2018 | 1975 | 04-Oct-2019 | 692 | $457 | Renovated/updated. |
| 109 250 FRANCIS WAY | $592,500 | $640,000 | -7.42 | $615,900 | 16-Sep-2019 | 2012 | 04-Oct-2019 | 1,023 | $579 | |
| 404 14 E ROYAL AVENUE | $560,000 | $649,000 | -13.71 | $747,500 | 23-May-2018 | 2005 | 04-Oct-2019 | 1,049 | $533 | |
| 1001 280 ROSS DRIVE | $420,000 | $391,000 | 7.42 | $429,900 | 25-Sep-2019 | 2010 | 04-Oct-2019 | 624 | $673 | |
| 717 1310 CARIBOO STREET | $395,000 | $420,500 | -6.06 | $399,900 | 03-Oct-2019 | 1991 | 04-Oct-2019 | 848 | $465 | |
| 328 22 E ROYAL AVENUE | $595,000 | $737,000 | -19.27 | $600,000 | 02-Oct-2019 | 2016 | 05-Oct-2019 | 1,004 | $592 | |
| 305 425 ASH STREET | $335,000 | $349,100 | -4.04 | $379,900 | 30-Apr-2019 | 1973 | 05-Oct-2019 | 932 | $359 | Renovated/updated. |
| PH3 608 BELMONT STREET | $1,047,800 | $1,164,000 | -9.98 | $1,239,000 | 09-Sep-2019 | 2011 | 05-Oct-2019 | 1,593 | $657 | |
| 302 619 FIFTH AVENUE | $588,000 | $596,000 | -1.34 | $609,900 | 18-Sep-2019 | 2011 | 05-Oct-2019 | 822 | $715 | |
| 404 11 E ROYAL AVENUE | $602,000 | $681,000 | -11.60 | $670,000 | 04-Jun-2019 | 2007 | 05-Oct-2019 | 1,102 | $546 | |
| 209 1240 QUAYSIDE DRIVE | $673,000 | $739,000 | -8.93 | $885,000 | 21-Jan-2019 | 1989 | 05-Oct-2019 | 1,735 | $387 | |
| 410 240 SALTER STREET | $550,000 | $562,000 | -2.14 | $568,800 | 09-Sep-2019 | 2008 | 06-Oct-2019 | 1,002 | $548 | |
| 209 211 TWELFTH STREET | $360,000 | $2 | 17999900.00 | $365,000 | 30-Sep-2019 | 1997 | 07-Oct-2019 | 716 | $502 | |
| 905 1065 QUAYSIDE DRIVE | $531,000 | $488,000 | 8.81 | $536,900 | 02-Oct-2019 | 1988 | 07-Oct-2019 | 934 | $568 | Renovated/updated. |
| 404 210 CARNARVON STREET | $412,000 | $437,700 | -5.87 | $419,800 | 23-Sep-2019 | 1994 | 08-Oct-2019 | 815 | $505 | |
| 1601 850 ROYAL AVENUE | $600,000 | $643,000 | -6.69 | $618,800 | 23-Sep-2019 | 2003 | 08-Oct-2019 | 997 | $601 | |
| 303 78 RICHMOND STREET | $445,000 | $481,000 | -7.48 | $535,800 | 04-Jul-2018 | 1994 | 09-Oct-2019 | 1,004 | $443 | Renovated/updated. |
| 1202 280 ROSS DRIVE | $605,000 | $586,000 | 3.24 | $628,000 | 13-Aug-2019 | 2010 | 10-Oct-2019 | 965 | $626 | |
| 312 315 KNOX STREET | $388,000 | $420,000 | -7.62 | $424,000 | 21-May-2019 | 2007 | 10-Oct-2019 | 621 | $624 | |
| 104 1205 FIFTH AVENUE | $445,000 | $485,000 | -8.25 | $430,000 | 08-Oct-2019 | 2005 | 10-Oct-2019 | 867 | $513 | |
| 301 1245 QUAYSIDE DRIVE | $574,900 | $627,000 | -8.31 | $599,900 | 03-Jul-2019 | 1990 | 11-Oct-2019 | 1,388 | $414 | |
| 410 20 E ROYAL AVENUE | $920,000 | $983,000 | -6.41 | $948,000 | 02-Jul-2019 | 2016 | 11-Oct-2019 | 1,273 | $722 | |
| 902 813 AGNES STREET | $418,000 | $440,000 | -5.00 | $429,900 | 08-Aug-2019 | 2006 | 12-Oct-2019 | 560 | $746 | |
| 703 200 NELSON’S CRESCENT | $585,000 | $626,000 | -6.55 | $599,000 | 23-Mar-2018 | 2017 | 12-Oct-2019 | 776 | $753 | |
| 105 245 ROSS DRIVE | $497,000 | $534,000 | -6.93 | $520,000 | 23-Sep-2019 | 2011 | 12-Oct-2019 | 825 | $602 | |
| 404 1235 QUAYSIDE DRIVE | $649,000 | $615,000 | 5.53 | $674,800 | 02-Aug-2019 | 1990 | 13-Oct-2019 | 1,406 | $461 | Renovated/updated. |
| 102 119 AGNES STREET | $345,000 | $387,700 | -11.01 | $339,900 | 07-Oct-2019 | 1975 | 13-Oct-2019 | 962 | $358 | Renovated/updated. |
| 1306 615 BELMONT STREET | $383,000 | $382,000 | 0.26 | $410,000 | 18-Jul-2019 | 1983 | 14-Oct-2019 | 832 | $460 | Renovated/updated. |
| 105 1135 QUAYSIDE DRIVE | $568,000 | $589,000 | -3.57 | $594,900 | 12-Aug-2019 | 1989 | 14-Oct-2019 | 1,203 | $472 | |
| 409 777 EIGHTH STREET | $538,000 | $593,000 | -9.27 | $549,900 | 25-Sep-2019 | 1987 | 18-Oct-2019 | 1,105 | $486 | Renovated/updated. |
| 1704 1235 QUAYSIDE DRIVE | $628,000 | $725,000 | -13.38 | $678,000 | 27-Jun-2019 | 1990 | 20-Oct-2019 | 1,416 | $443 | |
| 409 250 SALTER STREET | $598,000 | $624,000 | -4.17 | $619,000 | 15-Apr-2019 | 2006 | 20-Oct-2019 | 981 | $609 | |
| 501 306 SIXTH STREET | $530,000 | $602,000 | -11.96 | $559,000 | 23-Sep-2019 | 2009 | 20-Oct-2019 | 865 | $612 | |
| 1302 612 SIXTH STREET | $700,000 | $707,000 | -0.99 | $729,900 | 09-Oct-2019 | 1999 | 20-Oct-2019 | 1,275 | $549 | Renovated/updated. |
| 404 850 ROYAL AVENUE | $525,000 | $558,000 | -5.91 | $624,900 | 04-Jun-2019 | 2003 | 20-Oct-2019 | 969 | $541 | |
| 106 55 EIGHTH AVENUE | $439,000 | $459,000 | -4.36 | $429,888 | 14-Oct-2019 | 2012 | 20-Oct-2019 | 700 | $627 | |
| 312 225 FRANCIS WAY | $757,000 | $824,000 | -8.13 | $749,900 | 14-Oct-2019 | 2010 | 21-Oct-2019 | 1,324 | $571 | |
| 406 74 RICHMOND STREET | $499,000 | $539,000 | -7.42 | $519,000 | 23-Sep-2019 | 1995 | 21-Oct-2019 | 1,154 | $432 | Renovated/updated. |
| 1105 680 CLARKSON STREET | $314,000 | $291,000 | 7.90 | $319,000 | 01-Oct-2019 | 1998 | 21-Oct-2019 | 368 | $853 | Renovated/updated. |
| 2001 1245 QUAYSIDE DRIVE | $1,300,000 | $1,187,000 | 9.52 | $1,298,000 | 21-Oct-2019 | 1990 | 22-Oct-2019 | 2,128 | $610 | Renovated/updated. |
| 204 121 TENTH STREET | $489,000 | $467,000 | 4.71 | $510,000 | 05-Oct-2019 | 1990 | 22-Oct-2019 | 968 | $505 | |
| 308 135 ELEVENTH STREET | $389,500 | $394,000 | -1.14 | $419,900 | 09-Sep-2019 | 1994 | 22-Oct-2019 | 677 | $575 | |
| 111 20 E ROYAL AVENUE | $560,000 | $678,000 | -17.40 | $609,000 | 01-Oct-2019 | 2016 | 23-Oct-2019 | 923 | $606 |
37 out of 49 sold below assessed with a median sold price of -6.32
North Vancouver
| Address | Sold Price | Assessed | % Δ | True List Price | True List Date | Year Built | Sold Date | Sqft | Price per sqft | Notes |
|---|---|---|---|---|---|---|---|---|---|---|
| 415 680 SEYLYNN CRESCENT | $535,000 | $507,000 | 5.52 | $548,800 | 11-Sep-2019 | 2018 | 02-Oct-2019 | 605 | $884 | |
| 1603 1327 E KEITH ROAD | $674,000 | $748,000 | -9.89 | $875,000 | 12-Feb-2018 | 1992 | 02-Oct-2019 | 1,154 | $584 | |
| 607 199 VICTORY SHIP WAY | $716,000 | $755,000 | -5.17 | $739,000 | 20-Aug-2019 | 2015 | 02-Oct-2019 | 672 | $1,065 | |
| 120 119 W 22ND STREET | $660,000 | $729,000 | -9.47 | $660,000 | 27-Sep-2019 | 2012 | 02-Oct-2019 | 820 | $804 | |
| 204 733 W 3RD STREET | $525,000 | $542,000 | -3.14 | $519,000 | 30-Sep-2019 | 2015 | 02-Oct-2019 | 623 | $842 | |
| 410 3680 BANFF COURT | $920,000 | $933,000 | -1.39 | $998,000 | 27-Jun-2019 | 1992 | 03-Oct-2019 | 1,417 | $649 | Renovated/updated. |
| 413 719 W 3RD STREET | $675,000 | $711,000 | -5.06 | $699,000 | 12-Jul-2019 | 2017 | 03-Oct-2019 | 800 | $843 | |
| 2004 151 W 2ND STREET | $685,000 | $768,000 | -10.81 | $699,000 | 08-Apr-2019 | 2005 | 03-Oct-2019 | 667 | $1,026 | |
| 4 135 W 21ST STREET | $330,000 | $286,200 | 15.30 | $350,000 | 25-Sep-2019 | 1969 | 04-Oct-2019 | 603 | $547 | Renovated/updated. |
| 904 172 VICTORY SHIP WAY | $1,050,000 | $1,074,000 | -2.23 | $1,159,800 | 08-Apr-2019 | 2010 | 04-Oct-2019 | 1,043 | $1,006 | |
| 510 150 W 22ND STREET | $619,000 | $613,000 | 0.98 | $649,000 | 16-Sep-2019 | 1997 | 04-Oct-2019 | 833 | $743 | |
| 201 1201 W 16TH STREET | $725,000 | $756,000 | -4.10 | $759,000 | 17-Jun-2019 | 2015 | 04-Oct-2019 | 911 | $795 | |
| 412 1327 E KEITH ROAD | $421,500 | $416,000 | 1.32 | $439,900 | 06-Aug-2019 | 1992 | 05-Oct-2019 | 726 | $580 | |
| 507 255 W 1ST STREET | $774,000 | $898,000 | -13.81 | $788,000 | 27-Sep-2019 | 2017 | 05-Oct-2019 | 826 | $937 | |
| 109 1621 HAMILTON AVENUE | $580,000 | $591,000 | -1.86 | $588,000 | 16-Sep-2019 | 2015 | 06-Oct-2019 | 660 | $878 | |
| 1210 1327 E KEITH ROAD | $450,000 | $484,000 | -7.02 | $499,000 | 14-May-2019 | 1992 | 06-Oct-2019 | 806 | $558 | |
| 409 139 W 22ND STREET | $735,000 | $805,000 | -8.70 | $798,000 | 29-Mar-2019 | 2012 | 06-Oct-2019 | 857 | $857 | |
| 211 310 E 3RD STREET | $472,000 | $428,900 | 10.05 | $519,000 | 01-Jun-2019 | 1974 | 06-Oct-2019 | 824 | $572 | Renovated/updated. |
| 516 221 E 3RD STREET | $600,000 | $658,000 | -8.81 | $619,000 | 16-Sep-2019 | 2013 | 07-Oct-2019 | 602 | $996 | |
| 502 2024 FULLERTON AVENUE | $405,000 | $473,100 | -14.39 | $409,900 | 16-Sep-2019 | 1974 | 08-Oct-2019 | 789 | $513 | Renovated/updated. |
| 407 1677 LLOYD AVENUE | $545,500 | $570,000 | -4.30 | $568,800 | 09-Sep-2019 | 2011 | 08-Oct-2019 | 684 | $797 | |
| 108 139 W 22ND STREET | $799,000 | $859,000 | -6.98 | $839,000 | 11-Jul-2019 | 2012 | 08-Oct-2019 | 969 | $824 | |
| 316 1633 MACKAY AVENUE | $650,000 | $770,000 | -15.58 | $699,000 | 25-Mar-2019 | 2008 | 08-Oct-2019 | 980 | $663 | |
| 405 159 W 22ND STREET | $585,000 | $630,000 | -7.14 | $615,000 | 04-Sep-2019 | 2012 | 09-Oct-2019 | 655 | $893 | |
| 213 111 E 3RD STREET | $525,000 | $519,000 | 1.16 | $512,000 | 07-Oct-2019 | 2013 | 09-Oct-2019 | 526 | $998 | |
| 703 155 W 1ST STREET | $735,000 | $775,000 | -5.16 | $749,000 | 03-Oct-2019 | 2004 | 10-Oct-2019 | 747 | $983 | |
| 501 2004 FULLERTON AVENUE | $314,000 | $408,000 | -23.04 | $329,000 | 06-Oct-2019 | 1974 | 10-Oct-2019 | 594 | $528 | Renovated/updated. |
| 309 212 FORBES AVENUE | $425,000 | $468,700 | -9.32 | $457,900 | 18-Sep-2019 | 1977 | 10-Oct-2019 | 660 | $643 | Renovated/updated. |
| 802 124 W 1ST STREET | $818,000 | $858,000 | -4.66 | $849,000 | 12-Aug-2019 | 2002 | 11-Oct-2019 | 870 | $940 | |
| 203 170 E 3RD STREET | $382,500 | $437,200 | -12.51 | $439,000 | 08-Apr-2019 | 1974 | 11-Oct-2019 | 746 | $512 | |
| 803 2020 FULLERTON AVENUE | $460,000 | $613,000 | -24.96 | $620,000 | 08-Apr-2019 | 1975 | 11-Oct-2019 | 965 | $476 | |
| 1806 1550 FERN STREET | $568,000 | $654,000 | -13.15 | $568,000 | 08-Oct-2019 | 2015 | 12-Oct-2019 | 613 | $926 | |
| 203 111 W 5TH STREET | $500,000 | $588,000 | -14.97 | $500,000 | 11-Oct-2019 | 1994 | 12-Oct-2019 | 717 | $697 | |
| 1106 1550 FERN STREET | $535,000 | $581,000 | -7.92 | $599,900 | 15-Jul-2019 | 2015 | 13-Oct-2019 | 601 | $890 | |
| 604 151 W 2ND STREET | $615,000 | $681,000 | -9.69 | $649,000 | 09-Aug-2019 | 2005 | 14-Oct-2019 | 665 | $924 | |
| 711 2008 FULLERTON AVENUE | $315,000 | $415,400 | -24.17 | $340,000 | 04-Oct-2019 | 1974 | 15-Oct-2019 | 588 | $535 | Renovated/updated. |
| 1906 2008 FULLERTON AVENUE | $330,000 | $433,100 | -23.81 | $345,000 | 16-Sep-2019 | 1974 | 15-Oct-2019 | 527 | $626 | Renovated/updated. |
| 319 1633 MACKAY AVENUE | $658,000 | $807,000 | -18.46 | $713,000 | 10-Jun-2019 | 2008 | 15-Oct-2019 | 983 | $669 | |
| 408 1673 LLOYD AVENUE | $557,000 | $499,000 | 11.62 | $579,000 | 30-Jul-2019 | 2011 | 15-Oct-2019 | 693 | $803 | |
| 205 332 LONSDALE AVENUE | $645,000 | $663,000 | -2.71 | $665,000 | 13-Aug-2019 | 1997 | 15-Oct-2019 | 908 | $710 | |
| 319 119 W 22ND STREET | $662,000 | $746,000 | -11.26 | $699,900 | 07-Oct-2019 | 2012 | 16-Oct-2019 | 851 | $777 | |
| 505 1621 HAMILTON AVENUE | $895,000 | $953,000 | -6.09 | $1,099,000 | 20-Jun-2019 | 2015 | 16-Oct-2019 | 967 | $925 | |
| G02 159 W 22ND STREET | $1,018,000 | $1,119,000 | -9.03 | $1,148,000 | 03-May-2018 | 2012 | 16-Oct-2019 | 1,415 | $719 | |
| 414 147 E 1ST STREET | $580,000 | $543,000 | 6.81 | $629,900 | 11-Mar-2019 | 1998 | 16-Oct-2019 | 753 | $770 | |
| 219 119 W 22ND STREET | $670,000 | $733,000 | -8.59 | $739,800 | 04-Jun-2019 | 2012 | 17-Oct-2019 | 850 | $788 | |
| 102 341 MAHON AVENUE | $530,000 | $379,300 | 39.73 | $549,900 | 09-Sep-2019 | 1974 | 17-Oct-2019 | 592 | $895 | Renovated/updated. |
| 410 122 E 3RD STREET | $675,000 | $702,000 | -3.85 | $689,000 | 16-Sep-2019 | 2006 | 17-Oct-2019 | 858 | $786 | |
| 213 733 W 3RD STREET | $460,000 | $436,000 | 5.50 | $459,900 | 15-Oct-2019 | 2015 | 17-Oct-2019 | 498 | $923 | |
| 206 935 W 16TH STREET | $775,000 | $765,000 | 1.31 | $829,000 | 15-Oct-2019 | 2009 | 18-Oct-2019 | 997 | $777 | |
| 1902 125 E 14TH STREET | $850,000 | $962,000 | -11.64 | $879,000 | 15-Oct-2019 | 2017 | 18-Oct-2019 | 776 | $1,095 | |
| 507 188 E ESPLANADE | $625,000 | $676,000 | -7.54 | $699,000 | 08-Apr-2019 | 2008 | 19-Oct-2019 | 738 | $846 | |
| 905 1515 EASTERN AVENUE | $715,000 | $663,000 | 7.84 | $755,000 | 25-Sep-2019 | 1982 | 20-Oct-2019 | 945 | $756 | |
| 207 175 E 5TH STREET | $541,000 | $578,000 | -6.40 | $539,000 | 14-Oct-2019 | 1974 | 20-Oct-2019 | 963 | $561 | Renovated/updated. |
| 1203 2016 FULLERTON AVENUE | $285,000 | $390,300 | -26.98 | $385,000 | 08-Apr-2019 | 1972 | 21-Oct-2019 | 534 | $533 | Renovated/updated. |
| 305 1140 STRATHAVEN DRIVE | $820,000 | $852,000 | -3.76 | $888,000 | 17-Jul-2019 | 1995 | 23-Oct-2019 | 1,352 | $606 | |
| 1606 150 W 15TH STREET | $1,380,000 | $1,463,000 | -5.67 | $1,399,000 | 09-Sep-2019 | 2014 | 25-Oct-2019 | 1,075 | $1,283 | |
| 212 119 W 22ND STREET | $659,000 | $732,000 | -9.97 | $659,900 | 14-Oct-2019 | 2012 | 28-Oct-2019 | 854 | $771 |
45 out of 57 sold below assessed with a median sold price of -6.98
Delta
| Address | Sold Price | Assessed | % Δ | True List Price | True List Date | Year Built | Sold Date | Sqft | Price per sqft | Notes |
|---|---|---|---|---|---|---|---|---|---|---|
| 3108 11967 80 AVENUE | $540,000 | $655,000 | -17.56 | $648,500 | 15-Jul-2019 | 2017 | 02-Oct-2019 | 843 | $640 | |
| 106 4745 54A STREET | $400,000 | $367,200 | 8.93 | $419,000 | 31-May-2019 | 1997 | 04-Oct-2019 | 739 | $541 | Renovated/updated. |
| 107 4768 53 STREET | $395,000 | $396,800 | -0.45 | $417,000 | 15-Aug-2019 | 1995 | 06-Oct-2019 | 802 | $492 | |
| 402 1363 56 STREET | $507,500 | $545,000 | -6.88 | $539,000 | 23-Aug-2019 | 1997 | 10-Oct-2019 | 918 | $552 | Renovated/updated. |
| 204 1400 VIEW CRESCENT | $670,000 | $621,000 | 7.89 | $699,000 | 26-Jun-2019 | 1995 | 11-Oct-2019 | 1,308 | $512 | |
| 1806 11967 80 AVENUE | $470,000 | $521,000 | -9.79 | $549,888 | 03-Sep-2018 | 2017 | 15-Oct-2019 | 746 | $630 |
4 out of 6 sold below assessed with a median sold price of -3.67
Surrey
| Address | Sold Price | Assessed | % Δ | True List Price | True List Date | Year Built | Sold Date | Sqft | Price per sqft | Notes |
|---|---|---|---|---|---|---|---|---|---|---|
| 208 15368 16A AVENUE | $448,000 | $487,000 | -8.01 | $489,000 | 09-Aug-2019 | 2004 | 02-Oct-2019 | 903 | $496 | |
| 108 1760 SOUTHMERE CRESCENT | $283,000 | $347,600 | -18.58 | $288,000 | 30-Sep-2019 | 1980 | 02-Oct-2019 | 996 | $284 | |
| 107 15956 86A AVENUE | $453,000 | $486,000 | -6.79 | $459,800 | 09-Aug-2019 | 2013 | 02-Oct-2019 | 950 | $476 | |
| 101 15275 19 AVENUE | $427,500 | $441,900 | -3.26 | $449,000 | 03-Sep-2019 | 1982 | 02-Oct-2019 | 1,240 | $344 | |
| 215 15210 GUILDFORD DRIVE | $420,000 | $522,000 | -19.54 | $438,800 | 13-Sep-2019 | 1997 | 03-Oct-2019 | 1,209 | $347 | |
| 205 13775 74 AVENUE | $325,000 | $324,700 | 0.09 | $339,900 | 11-Sep-2019 | 1984 | 03-Oct-2019 | 856 | $379 | Renovated/updated. |
| 2306 13696 100 AVENUE | $520,000 | $581,000 | -10.50 | $575,000 | 31-May-2019 | 2017 | 03-Oct-2019 | 776 | $670 | |
| 407 14333 104 AVENUE | $455,000 | $448,000 | 1.56 | $460,000 | 05-Jul-2019 | 2009 | 03-Oct-2019 | 1,073 | $424 | |
| 205 17730 58A AVENUE | $385,000 | $379,000 | 1.58 | $390,000 | 27-Sep-2019 | 1994 | 03-Oct-2019 | 973 | $395 | Renovated/updated. |
| 311 8733 160 STREET | $356,000 | $371,000 | -4.04 | $375,000 | 12-Aug-2019 | 2015 | 03-Oct-2019 | 673 | $528 | |
| 116 10788 139 STREET | $280,000 | $275,000 | 1.82 | $299,000 | 30-May-2019 | 2006 | 04-Oct-2019 | 599 | $467 | |
| 460 6758 188 STREET | $380,000 | $442,000 | -14.03 | $419,606 | 08-Sep-2019 | 2010 | 04-Oct-2019 | 762 | $498 | Renovated/updated. |
| 113 10438 148 STREET | $330,000 | $340,100 | -2.97 | $370,000 | 29-May-2018 | 1984 | 05-Oct-2019 | 889 | $371 | Renovated/updated. |
| 2503 13303 CENTRAL AVENUE | $494,800 | $601,000 | -17.67 | $525,000 | 15-Apr-2019 | 2015 | 05-Oct-2019 | 773 | $640 | |
| 109 14885 105 AVENUE | $310,000 | $300,000 | 3.33 | $335,900 | 19-Apr-2019 | 2003 | 06-Oct-2019 | 646 | $479 | Renovated/updated. |
| 306 13383 108 AVENUE | $305,000 | $279,000 | 9.32 | $325,800 | 20-Aug-2019 | 1993 | 06-Oct-2019 | 653 | $467 | |
| 306 13398 104 AVENUE | $320,000 | $309,000 | 3.56 | $349,900 | 27-May-2019 | 2016 | 06-Oct-2019 | 525 | $609 | |
| 113 6385 121 STREET | $449,000 | $481,300 | -6.71 | $459,000 | 27-Sep-2019 | 1996 | 06-Oct-2019 | 1,053 | $426 | Renovated/updated. |
| 219 15956 86A AVENUE | $410,000 | $451,000 | -9.09 | $464,900 | 22-Apr-2019 | 2013 | 06-Oct-2019 | 828 | $495 | |
| B403 9866 WHALLEY BOULEVARD | $463,000 | $494,800 | -6.43 | $449,900 | 01-Oct-2019 | 1993 | 06-Oct-2019 | 1,265 | $366 | |
| 111 6363 121 STREET | $409,000 | $459,000 | -10.89 | $429,000 | 03-Sep-2019 | 1994 | 07-Oct-2019 | 1,124 | $363 | Renovated/updated. |
| 315 10499 UNIVERSITY DRIVE | $317,500 | $349,000 | -9.03 | $349,000 | 12-Mar-2019 | 2006 | 07-Oct-2019 | 574 | $553 | |
| 207 15155 22 AVENUE | $490,000 | $535,000 | -8.41 | $525,000 | 23-Apr-2019 | 1992 | 07-Oct-2019 | 1,112 | $440 | Renovated/updated. |
| 305 19366 65 AVENUE | $396,000 | $455,000 | -12.97 | $429,000 | 15-Aug-2019 | 2005 | 07-Oct-2019 | 869 | $455 | |
| 1409 13618 100 AVENUE | $411,000 | $447,000 | -8.05 | $419,900 | 02-Oct-2019 | 2008 | 08-Oct-2019 | 771 | $533 | |
| 47 19478 65 AVENUE | $355,000 | $339,000 | 4.72 | $350,000 | 07-Oct-2019 | 2009 | 08-Oct-2019 | 700 | $507 | Renovated/updated. |
| 107 17727 58 AVENUE | $380,000 | $431,000 | -11.83 | $385,000 | 03-Oct-2019 | 1996 | 08-Oct-2019 | 1,115 | $340 | Renovated/updated. |
| 412 9655 KING GEORGE BOULEVARD | $365,000 | $392,500 | -7.01 | $373,000 | 28-Aug-2019 | 2009 | 08-Oct-2019 | 673 | $542 | |
| 2307 13696 100 AVENUE | $375,000 | $398,000 | -5.78 | $425,000 | 06-Jun-2019 | 2017 | 08-Oct-2019 | 512 | $732 | |
| 222 7161 121 STREET | $373,000 | $455,000 | -18.02 | $399,000 | 01-Aug-2019 | 1991 | 08-Oct-2019 | 1,321 | $282 | |
| 451 6758 188 STREET | $322,500 | $339,000 | -4.87 | $339,900 | 18-Sep-2018 | 2010 | 08-Oct-2019 | 582 | $554 | |
| 4602 13495 CENTRAL AVENUE | $425,000 | $489,000 | -13.09 | $435,000 | 07-Oct-2019 | 2018 | 09-Oct-2019 | 563 | $754 | |
| 406 9672 134 STREET | $335,000 | $434,000 | -22.81 | $379,900 | 23-Jul-2019 | 1984 | 09-Oct-2019 | 1,076 | $311 | |
| 106 12769 72 AVENUE | $280,000 | $290,400 | -3.58 | $349,000 | 11-Jun-2018 | 1994 | 09-Oct-2019 | 703 | $398 | |
| 304 13226 104 AVENUE | $480,000 | $540,000 | -11.11 | $499,000 | 29-Sep-2019 | 1994 | 09-Oct-2019 | 1,350 | $355 | |
| 405 13688 100 AVENUE | $354,000 | $359,000 | -1.39 | $419,900 | 10-May-2018 | 2011 | 09-Oct-2019 | 577 | $613 | |
| 307 7473 140 STREET | $332,500 | $384,400 | -13.50 | $419,000 | 11-Jul-2019 | 1975 | 09-Oct-2019 | 1,253 | $265 | Renovated/updated. |
| 425 13228 OLD YALE ROAD | $444,000 | $510,000 | -12.94 | $445,000 | 03-Oct-2019 | 2014 | 10-Oct-2019 | 888 | $500 | |
| 111 10082 132 STREET | $285,000 | $271,300 | 5.05 | $292,000 | 09-Sep-2019 | 1994 | 10-Oct-2019 | 700 | $407 | Renovated/updated. |
| 4206 13696 100 AVENUE | $540,000 | $659,000 | -18.06 | $642,000 | 18-Mar-2019 | 2017 | 10-Oct-2019 | 776 | $695 | |
| 2209 13325 102A AVENUE | $345,000 | $430,000 | -19.77 | $398,000 | 06-Aug-2019 | 2013 | 11-Oct-2019 | 626 | $551 | |
| 103 15140 108 AVENUE | $295,000 | $301,700 | -2.22 | $310,000 | 12-Aug-2019 | 1993 | 11-Oct-2019 | 686 | $430 | Renovated/updated. |
| 1805 13696 100 AVENUE | $379,000 | $382,000 | -0.79 | $404,000 | 12-Sep-2019 | 2017 | 11-Oct-2019 | 538 | $704 | |
| 210 9278 120 STREET | $320,000 | $325,700 | -1.75 | $359,900 | 20-May-2019 | 1966 | 11-Oct-2019 | 775 | $412 | Renovated/updated. |
| 320 15210 GUILDFORD DRIVE | $440,000 | $532,000 | -17.29 | $448,000 | 09-Oct-2019 | 1997 | 11-Oct-2019 | 1,224 | $359 | |
| 104 15188 29A AVENUE | $458,000 | $470,000 | -2.55 | $529,900 | 23-Apr-2018 | 2014 | 12-Oct-2019 | 845 | $542 | |
| 102 13965 16 AVENUE | $330,000 | $407,100 | -18.94 | $399,000 | 17-Apr-2019 | 1988 | 12-Oct-2019 | 973 | $339 | |
| 1802 13495 CENTRAL AVENUE | $408,000 | $396,000 | 3.03 | $409,900 | 10-Sep-2019 | 2018 | 13-Oct-2019 | 563 | $724 | |
| 303 7161 121 STREET | $395,000 | $431,000 | -8.35 | $399,800 | 10-Oct-2019 | 1991 | 13-Oct-2019 | 1,232 | $320 | |
| 314 10688 140 STREET | $330,000 | $333,000 | -0.90 | $340,000 | 22-May-2019 | 2018 | 13-Oct-2019 | 550 | $600 | |
| 802 15030 101 AVENUE | $478,800 | $524,000 | -8.63 | $478,800 | 07-Oct-2019 | 1990 | 13-Oct-2019 | 1,241 | $385 | |
| 202 12101 80 AVENUE | $309,000 | $275,400 | 12.20 | $298,000 | 07-Oct-2019 | 1990 | 14-Oct-2019 | 878 | $351 | |
| 102 9946 151 STREET | $402,000 | $391,000 | 2.81 | $419,500 | 27-Aug-2019 | 1992 | 14-Oct-2019 | 1,022 | $393 | |
| 116 12160 80 AVENUE | $350,000 | $315,400 | 10.97 | $368,000 | 07-Oct-2019 | 1993 | 14-Oct-2019 | 797 | $439 | Renovated/updated. |
| 1802 13618 100 AVENUE | $460,000 | $525,000 | -12.38 | $489,000 | 19-Jun-2019 | 2008 | 15-Oct-2019 | 911 | $504 | |
| 105 15988 26 AVENUE | $382,500 | $397,000 | -3.65 | $409,000 | 18-Sep-2019 | 2008 | 15-Oct-2019 | 655 | $583 | |
| 304 15558 16A AVENUE | $450,000 | $476,000 | -5.46 | $479,000 | 26-Aug-2019 | 1995 | 15-Oct-2019 | 1,201 | $374 | Renovated/updated. |
| 203 19228 64 AVENUE | $380,000 | $405,000 | -6.17 | $448,800 | 14-Aug-2019 | 2016 | 16-Oct-2019 | 714 | $532 | |
| 303 13325 102A AVENUE | $220,000 | $235,000 | -6.38 | $299,000 | 15-Oct-2018 | 2013 | 16-Oct-2019 | 399 | $551 | |
| 205 13728 108 AVENUE | $290,000 | $269,600 | 7.57 | $309,000 | 01-Aug-2019 | 2012 | 17-Oct-2019 | 547 | $530 | |
| 101 14945 100 AVENUE | $298,000 | $339,000 | -12.09 | $298,800 | 15-Oct-2019 | 1981 | 17-Oct-2019 | 889 | $335 | |
| 104 6960 120 STREET | $435,000 | $434,000 | 0.23 | $459,000 | 26-Aug-2019 | 2009 | 17-Oct-2019 | 1,007 | $431 | |
| 322 13733 107A AVENUE | $254,000 | $238,800 | 6.37 | $249,000 | 24-Sep-2019 | 2009 | 18-Oct-2019 | 416 | $610 | |
| 1108 13325 102A AVENUE | $332,800 | $380,000 | -12.42 | $331,800 | 11-Oct-2019 | 2013 | 19-Oct-2019 | 590 | $564 | |
| 214 6960 120 STREET | $435,000 | $429,000 | 1.40 | $450,000 | 17-Aug-2018 | 2009 | 19-Oct-2019 | 1,078 | $403 | |
| 2008 13399 104 AVENUE | $442,000 | $480,000 | -7.92 | $479,900 | 20-Sep-2019 | 2009 | 20-Oct-2019 | 759 | $582 | |
| 210 19228 64 AVENUE | $310,000 | $319,000 | -2.82 | $346,900 | 15-Apr-2019 | 2016 | 20-Oct-2019 | 566 | $547 | |
| 408 10560 154 STREET | $248,000 | $242,600 | 2.23 | $299,000 | 06-Mar-2019 | 1982 | 22-Oct-2019 | 657 | $377 | Renovated/updated. |
50 out of 68 sold below assessed with a median sold price of -6.28
Port Moody
| Address | Sold Price | Assessed | % Δ | True List Price | True List Date | Year Built | Sold Date | Sqft | Price per sqft | Notes |
|---|---|---|---|---|---|---|---|---|---|---|
| 314 400 KLAHANIE DRIVE | $754,000 | $822,000 | -8.27 | $798,000 | 11-Jun-2019 | 2005 | 03-Oct-2019 | 1,195 | $630 | |
| 105 101 MORRISSEY ROAD | $495,000 | $538,000 | -7.99 | $509,900 | 09-Sep-2019 | 2008 | 04-Oct-2019 | 695 | $712 | |
| 607 200 NEWPORT DRIVE | $515,000 | $497,000 | 3.62 | $559,000 | 30-Jul-2019 | 1996 | 07-Oct-2019 | 933 | $551 | |
| 206 101 MORRISSEY ROAD | $482,000 | $524,000 | -8.02 | $500,000 | 30-Sep-2019 | 2008 | 11-Oct-2019 | 700 | $688 | |
| 908 660 NOOTKA WAY | $612,800 | $612,000 | 0.13 | $639,900 | 23-Sep-2019 | 2009 | 14-Oct-2019 | 908 | $674 | |
| 401 235 GUILDFORD WAY | $750,000 | $734,000 | 2.18 | $739,000 | 11-Oct-2019 | 2004 | 15-Oct-2019 | 1,241 | $604 | |
| 336 204 WESTHILL PLACE | $365,000 | $390,700 | -6.58 | $395,000 | 12-Aug-2019 | 1970 | 16-Oct-2019 | 946 | $385 | Renovated/updated. |
| 1303 295 GUILDFORD WAY | $720,000 | $751,000 | -4.13 | $729,900 | 10-Oct-2019 | 2005 | 17-Oct-2019 | 1,097 | $656 | |
| 410 121 BREW STREET | $455,000 | $473,000 | -3.81 | $468,000 | 11-Oct-2019 | 2008 | 21-Oct-2019 | 594 | $765 |
6 out of 9 sold below assessed with a median sold price of -4.13
Coquitlam
| Address | Sold Price | Assessed | % Δ | True List Price | True List Date | Year Built | Sold Date | Sqft | Price per sqft | Notes |
|---|---|---|---|---|---|---|---|---|---|---|
| 1002 1155 THE HIGH STREET | $540,000 | $664,000 | -18.67 | $728,000 | 12-Mar-2018 | 2012 | 02-Oct-2019 | 883 | $611 | |
| 111 2990 PRINCESS CRESCENT | $479,000 | $597,000 | -19.77 | $519,900 | 06-Aug-2019 | 1993 | 03-Oct-2019 | 1,184 | $404 | Renovated/updated. |
| 103 611 REGAN AVENUE | $605,000 | $612,000 | -1.14 | $619,900 | 28-Aug-2019 | 2015 | 03-Oct-2019 | 879 | $688 | |
| 111 3156 DAYANEE SPRINGS BOULEVARD | $605,000 | $658,000 | -8.05 | $638,800 | 08-Jul-2019 | 2012 | 04-Oct-2019 | 1,010 | $599 | |
| 1902 1185 THE HIGH STREET | $703,000 | $763,000 | -7.86 | $719,900 | 11-Sep-2019 | 2009 | 04-Oct-2019 | 1,158 | $607 | |
| 107 2995 PRINCESS CRESCENT | $419,900 | $472,000 | -11.04 | $419,900 | 04-Oct-2019 | 1993 | 05-Oct-2019 | 1,062 | $395 | |
| 307 575 DELESTRE AVENUE | $347,000 | $374,000 | -7.22 | $365,000 | 26-Sep-2019 | 2008 | 05-Oct-2019 | 443 | $783 | |
| 2307 3080 LINCOLN AVENUE | $615,000 | $713,000 | -13.74 | $650,000 | 27-May-2019 | 2016 | 05-Oct-2019 | 865 | $710 | |
| 506 2968 GLEN DRIVE | $470,000 | $443,000 | 6.09 | $489,900 | 09-Jul-2019 | 2012 | 05-Oct-2019 | 631 | $744 | |
| 301 1190 EASTWOOD STREET | $440,000 | $459,000 | -4.14 | $469,800 | 23-Jul-2019 | 1995 | 06-Oct-2019 | 860 | $511 | Renovated/updated. |
| 418 3050 DAYANEE SPRINGS BOULEVARD | $490,000 | $492,000 | -0.41 | $498,000 | 04-Oct-2019 | 2008 | 07-Oct-2019 | 770 | $636 | |
| 102 2925 GLEN DRIVE | $385,000 | $350,000 | 10.00 | $379,900 | 04-Oct-2019 | 1989 | 07-Oct-2019 | 795 | $484 | |
| 211 617 SMITH AVENUE | $450,000 | $500,000 | -10.00 | $479,000 | 01-Oct-2019 | 2013 | 07-Oct-2019 | 636 | $707 | |
| 104 827 RODERICK AVENUE | $420,000 | $405,000 | 3.70 | $429,900 | 02-Oct-2019 | 2014 | 07-Oct-2019 | 632 | $664 | |
| 1505 2978 GLEN DRIVE | $657,000 | $704,000 | -6.68 | $629,000 | 12-Aug-2016 | 2009 | 07-Oct-2019 | 1,030 | $637 | |
| 317 630 CLARKE ROAD | $329,900 | $323,400 | 2.01 | $329,900 | 01-Oct-2019 | 1969 | 08-Oct-2019 | 688 | $479 | Renovated/updated. |
| 3104 3080 LINCOLN AVENUE | $455,000 | $500,000 | -9.00 | $499,999 | 20-Feb-2019 | 2016 | 08-Oct-2019 | 538 | $845 | |
| 202 1045 HOWIE AVENUE | $330,000 | $391,100 | -15.62 | $488,000 | 25-Apr-2018 | 1970 | 09-Oct-2019 | 899 | $367 | |
| 1603 1155 THE HIGH STREET | $620,000 | $686,000 | -9.62 | $648,800 | 05-Sep-2019 | 2012 | 09-Oct-2019 | 893 | $694 | Renovated/updated. |
| 2207 3100 WINDSOR GATE | $968,000 | $901,000 | 7.44 | $1,049,000 | 11-Jun-2019 | 2018 | 09-Oct-2019 | 1,260 | $768 | |
| 1708 2975 ATLANTIC AVENUE | $550,000 | $588,000 | -6.46 | $570,000 | 01-Feb-2017 | 2014 | 09-Oct-2019 | 813 | $676 | |
| 1002 518 WHITING WAY | $465,000 | $499,000 | -6.81 | $468,800 | 24-Sep-2019 | 2018 | 10-Oct-2019 | 550 | $845 | |
| 1908 520 COMO LAKE AVENUE | $493,800 | $539,000 | -8.39 | $498,000 | 07-Oct-2019 | 2017 | 10-Oct-2019 | 604 | $817 | |
| 118 1150 KENSAL PLACE | $434,277 | $491,000 | -11.55 | $468,800 | 11-Sep-2019 | 2012 | 11-Oct-2019 | 696 | $623 | |
| 906 511 ROCHESTER AVENUE | $430,000 | $447,000 | -3.80 | $445,000 | 20-Jul-2019 | 2007 | 11-Oct-2019 | 650 | $661 | |
| 1804 2959 GLEN DRIVE | $585,000 | $625,000 | -6.40 | $614,900 | 21-Aug-2019 | 2009 | 11-Oct-2019 | 927 | $631 | |
| 706 2978 GLEN DRIVE | $622,000 | $672,000 | -7.44 | $699,000 | 22-May-2018 | 2009 | 11-Oct-2019 | 1,029 | $604 | |
| 201 1189 WESTWOOD STREET | $425,000 | $466,000 | -8.80 | $469,900 | 28-Jun-2019 | 1993 | 12-Oct-2019 | 918 | $462 | Renovated/updated. |
| 3801 1188 PINETREE WAY | $635,000 | $698,000 | -9.03 | $659,000 | 24-Sep-2019 | 2016 | 12-Oct-2019 | 809 | $784 | |
| 2007 511 ROCHESTER AVENUE | $551,800 | $652,000 | -15.37 | $649,000 | 11-Jun-2019 | 2007 | 12-Oct-2019 | 970 | $568 | |
| 4102 1188 PINETREE WAY | $485,000 | $533,000 | -9.01 | $512,800 | 03-Oct-2019 | 2016 | 14-Oct-2019 | 576 | $842 | |
| 312 828 GAUTHIER AVENUE | $438,000 | $461,000 | -4.99 | $450,000 | 25-Sep-2019 | 2018 | 14-Oct-2019 | 615 | $712 | |
| 1501 1199 EASTWOOD STREET | $585,000 | $608,000 | -3.78 | $738,000 | 24-Sep-2018 | 1995 | 15-Oct-2019 | 1,041 | $561 | |
| 403 1438 PARKWAY BOULEVARD | $575,000 | $599,000 | -4.01 | $575,000 | 16-Sep-2019 | 1999 | 15-Oct-2019 | 1,165 | $493 | |
| 1903 1148 HEFFLEY CRESCENT | $877,500 | $1,058,000 | -17.06 | $1,188,800 | 21-Sep-2018 | 1998 | 15-Oct-2019 | 1,830 | $479 | Renovated/updated. |
| 304 523 WHITING WAY | $523,000 | $556,000 | -5.94 | $579,900 | 04-Jul-2019 | 1993 | 16-Oct-2019 | 996 | $525 | Renovated/updated. |
| 706 2968 GLEN DRIVE | $430,000 | $442,000 | -2.71 | $489,000 | 10-Jun-2019 | 2012 | 17-Oct-2019 | 631 | $681 | |
| 405 1196 PIPELINE ROAD | $625,000 | $662,000 | -5.59 | $649,900 | 10-Oct-2019 | 1997 | 17-Oct-2019 | 1,334 | $468 | |
| 1205 1178 HEFFLEY CRESCENT | $417,000 | $422,000 | -1.18 | $428,000 | 10-Oct-2019 | 2008 | 17-Oct-2019 | 650 | $641 | Renovated/updated. |
| 303 2958 WHISPER WAY | $571,000 | $589,000 | -3.06 | $599,900 | 07-Oct-2019 | 2005 | 18-Oct-2019 | 989 | $577 | Renovated/updated. |
| 101 3071 GLEN DRIVE | $425,000 | $527,000 | -19.35 | $425,000 | 09-Oct-2019 | 1993 | 18-Oct-2019 | 1,033 | $411 | Renovated/updated. |
| 409 1196 PIPELINE ROAD | $570,000 | $660,000 | -13.64 | $549,900 | 10-Oct-2019 | 1997 | 19-Oct-2019 | 1,304 | $437 | |
| 306 520 COMO LAKE AVENUE | $470,000 | $489,000 | -3.89 | $475,000 | 15-Oct-2019 | 2017 | 20-Oct-2019 | 600 | $783 | |
| 315 3178 DAYANEE SPRINGS BOULEVARD | $598,000 | $677,000 | -11.67 | $608,000 | 16-Sep-2019 | 2012 | 21-Oct-2019 | 1,043 | $573 | |
| 2103 570 EMERSON STREET | $489,900 | $508,000 | -3.56 | $489,900 | 16-Oct-2019 | 2017 | 21-Oct-2019 | 569 | $860 | |
| 1701 1190 PIPELINE ROAD | $650,000 | $721,000 | -9.85 | $729,900 | 16-Jul-2019 | 1995 | 26-Oct-2019 | 1,331 | $488 |
41 out of 46 sold below assessed with a median sold price of -7.02
Port Coquitlam
| Address | Sold Price | Assessed | % Δ | True List Price | True List Date | Year Built | Sold Date | Sqft | Price per sqft | Notes |
|---|---|---|---|---|---|---|---|---|---|---|
| 417 2393 RANGER LANE | $426,000 | $433,000 | -1.62 | $449,900 | 31-Jul-2019 | 2018 | 02-Oct-2019 | 660 | $645 | |
| 418 2343 ATKINS AVENUE | $381,500 | $415,000 | -8.07 | $399,000 | 27-May-2019 | 2011 | 03-Oct-2019 | 645 | $591 | |
| 104 1576 GRANT AVENUE | $415,000 | $471,000 | -11.89 | $419,000 | 26-Sep-2019 | 2004 | 03-Oct-2019 | 885 | $468 | |
| 205 2628 MAPLE STREET | $530,000 | $687,000 | -22.85 | $555,000 | 31-May-2019 | 2008 | 04-Oct-2019 | 1,260 | $420 | |
| 203 1999 SUFFOLK AVENUE | $358,000 | $366,000 | -2.19 | $389,000 | 01-May-2019 | 1997 | 04-Oct-2019 | 809 | $442 | |
| 302 2340 HAWTHORNE AVENUE | $415,000 | $435,000 | -4.60 | $435,000 | 04-Oct-2019 | 1993 | 05-Oct-2019 | 901 | $460 | |
| 308 2357 WHYTE AVENUE | $364,000 | $382,000 | -4.71 | $385,000 | 27-May-2019 | 1994 | 05-Oct-2019 | 801 | $454 | Renovated/updated. |
| 24 2120 CENTRAL AVENUE | $305,000 | $278,200 | 9.63 | $300,000 | 02-Oct-2019 | 1995 | 05-Oct-2019 | 581 | $524 | Renovated/updated. |
| 108 2620 JANE STREET | $370,000 | $430,000 | -13.95 | $399,000 | 24-Sep-2019 | 1994 | 06-Oct-2019 | 1,018 | $363 | Renovated/updated. |
| 303 2615 JANE STREET | $330,000 | $419,000 | -21.24 | $379,000 | 08-Mar-2019 | 1994 | 07-Oct-2019 | 872 | $378 | |
| 204 2330 WILSON AVENUE | $448,000 | $491,000 | -8.76 | $479,000 | 16-May-2019 | 2005 | 08-Oct-2019 | 928 | $482 | |
| 307 1570 PRAIRIE AVENUE | $339,000 | $375,000 | -9.60 | $375,000 | 12-Jun-2018 | 1995 | 08-Oct-2019 | 816 | $415 | |
| 412 1669 GRANT AVENUE | $351,000 | $364,000 | -3.57 | $349,900 | 25-Sep-2019 | 1996 | 09-Oct-2019 | 751 | $467 | Renovated/updated. |
| 108 2468 ATKINS AVENUE | $450,000 | $464,000 | -3.02 | $478,999 | 14-Mar-2019 | 2005 | 12-Oct-2019 | 895 | $502 | |
| 409 2214 KELLY AVENUE | $400,000 | $426,000 | -6.10 | $419,900 | 12-Aug-2019 | 2013 | 13-Oct-2019 | 686 | $583 | |
| 206 2353 MARPOLE AVENUE | $467,000 | $498,000 | -6.22 | $498,000 | 09-Sep-2019 | 2007 | 14-Oct-2019 | 922 | $506 | |
| 202 1988 SUFFOLK AVENUE | $340,000 | $435,000 | -21.84 | $355,000 | 18-Jul-2019 | 2009 | 15-Oct-2019 | 750 | $453 | |
| 408 2346 MCALLISTER AVENUE | $394,000 | $437,000 | -9.84 | $399,900 | 07-Oct-2019 | 2006 | 17-Oct-2019 | 713 | $552 | |
| 203 2425 SHAUGHNESSY STREET | $230,000 | $265,800 | -13.47 | $275,000 | 14-Jun-2019 | 1974 | 26-Oct-2019 | 686 | $335 |
18 out of 19 sold below assessed with a median sold price of -8.07
Pitt Meadows
| Address | Sold Price | Assessed | % Δ | True List Price | True List Date | Year Built | Sold Date | Sqft | Price per sqft | Notes |
|---|---|---|---|---|---|---|---|---|---|---|
| 104 12635 190A STREET | $495,000 | $512,000 | -3.32 | $499,000 | 30-May-2019 | 2012 | 03-Oct-2019 | 945 | $523 | |
| 130 19677 MEADOW GARDENS WAY | $658,000 | $663,000 | -0.75 | $699,000 | 01-May-2018 | 2007 | 08-Oct-2019 | 1,530 | $430 | |
| 112 12635 190A STREET | $440,000 | $452,000 | -2.65 | $499,900 | 07-Mar-2018 | 2012 | 17-Oct-2019 | 780 | $564 |
3 out of 3 sold below assessed with a median sold price of -2.65
Langley
| Address | Sold Price | Assessed | % Δ | True List Price | True List Date | Year Built | Sold Date | Sqft | Price per sqft | Notes |
|---|---|---|---|---|---|---|---|---|---|---|
| 109 20727 DOUGLAS CRESCENT | $295,000 | $305,000 | -3.28 | $309,900 | 21-Aug-2019 | 1993 | 02-Oct-2019 | 950 | $310 | |
| C209 8929 202 STREET | $340,000 | $348,000 | -2.30 | $348,800 | 13-Sep-2019 | 2008 | 03-Oct-2019 | 718 | $473 | |
| 225 5655 210A STREET | $415,000 | $504,000 | -17.66 | $429,785 | 23-Sep-2019 | 2011 | 04-Oct-2019 | 1,015 | $408 | |
| 405 20189 54 AVENUE | $374,800 | $400,000 | -6.30 | $374,800 | 03-Oct-2019 | 1994 | 04-Oct-2019 | 1,042 | $359 | |
| 401 20460 DOUGLAS CRESCENT | $368,000 | $436,000 | -15.60 | $425,000 | 28-Jun-2018 | 2011 | 05-Oct-2019 | 854 | $430 | |
| 223 5655 210A STREET | $352,000 | $367,000 | -4.09 | $359,900 | 20-Sep-2019 | 2011 | 05-Oct-2019 | 732 | $480 | |
| 302 22015 48 AVENUE | $430,000 | $467,000 | -7.92 | $439,000 | 02-Oct-2019 | 1994 | 05-Oct-2019 | 1,152 | $373 | Renovated/updated. |
| 403 5646 200 STREET | $389,000 | $395,000 | -1.52 | $390,000 | 30-Sep-2019 | 1992 | 05-Oct-2019 | 1,191 | $326 | |
| 409 5430 201 STREET | $370,000 | $449,000 | -17.59 | $425,000 | 03-Jun-2019 | 2006 | 06-Oct-2019 | 1,175 | $314 | |
| 130 8915 202 STREET | $260,000 | $246,900 | 5.31 | $279,000 | 07-Sep-2019 | 2009 | 06-Oct-2019 | 419 | $620 | |
| 216 22022 49 AVENUE | $388,500 | $465,000 | -16.45 | $399,900 | 01-Oct-2019 | 1997 | 07-Oct-2019 | 1,100 | $353 | |
| 305 19750 64 AVENUE | $325,000 | $399,500 | -18.65 | $339,800 | 09-Aug-2019 | 1996 | 07-Oct-2019 | 741 | $438 | Renovated/updated. |
| 116 20454 53 AVENUE | $262,000 | $252,900 | 3.60 | $279,500 | 03-Jul-2019 | 1981 | 07-Oct-2019 | 675 | $388 | Renovated/updated. |
| 211 20454 53 AVENUE | $282,000 | $297,500 | -5.21 | $299,000 | 14-May-2019 | 1981 | 07-Oct-2019 | 809 | $348 | Renovated/updated. |
| 204 23255 BILLY BROWN ROAD | $468,000 | $540,000 | -13.33 | $519,000 | 10-Sep-2019 | 2012 | 08-Oct-2019 | 707 | $661 | |
| 407 20460 DOUGLAS CRESCENT | $320,000 | $334,000 | -4.19 | $324,900 | 07-Oct-2019 | 2011 | 08-Oct-2019 | 601 | $532 | |
| 112 20448 PARK AVENUE | $320,000 | $391,000 | -18.16 | $349,000 | 29-Aug-2019 | 1995 | 09-Oct-2019 | 1,022 | $313 | |
| 408 20245 53 AVENUE | $365,500 | $440,000 | -16.93 | $364,900 | 08-Oct-2019 | 1994 | 09-Oct-2019 | 1,092 | $334 | |
| 309 5430 201 STREET | $440,000 | $452,000 | -2.65 | $455,000 | 30-Sep-2019 | 2006 | 10-Oct-2019 | 1,192 | $369 | |
| 102 5438 198 STREET | $369,000 | $383,000 | -3.66 | $379,900 | 23-Sep-2019 | 2005 | 10-Oct-2019 | 860 | $429 | |
| 352 8328 207A STREET | $394,500 | $423,000 | -6.74 | $409,000 | 06-Sep-2019 | 2012 | 10-Oct-2019 | 780 | $505 | |
| 303 20078 FRASER HIGHWAY | $344,000 | $395,000 | -12.91 | $365,000 | 23-Sep-2019 | 2015 | 11-Oct-2019 | 675 | $509 | |
| 112 5465 203 STREET | $375,000 | $417,000 | -10.07 | $498,000 | 16-May-2019 | 2004 | 11-Oct-2019 | 946 | $396 | Renovated/updated. |
| 108 20145 55A AVENUE | $390,000 | $455,000 | -14.29 | $398,900 | 20-Aug-2019 | 1994 | 11-Oct-2019 | 1,119 | $348 | |
| 207 20829 77A AVENUE | $435,000 | $520,000 | -16.35 | $439,900 | 02-Oct-2019 | 2018 | 12-Oct-2019 | 847 | $513 | |
| 133 8157 207 STREET | $644,000 | $574,000 | 12.20 | $654,000 | 04-Sep-2019 | 2016 | 12-Oct-2019 | 1,375 | $468 | |
| 303 20750 DUNCAN WAY | $395,000 | $428,000 | -7.71 | $409,900 | 25-Sep-2019 | 2006 | 12-Oct-2019 | 954 | $414 | |
| B201 20211 66 AVENUE | $315,000 | $301,000 | 4.65 | $327,000 | 09-Oct-2019 | 2012 | 13-Oct-2019 | 520 | $605 | |
| 225 8880 202 STREET | $260,000 | $286,600 | -9.28 | $369,900 | 13-Aug-2018 | 2005 | 13-Oct-2019 | 567 | $458 | |
| 403 20453 53 AVENUE | $367,000 | $389,000 | -5.66 | $399,000 | 21-Aug-2019 | 1993 | 16-Oct-2019 | 1,104 | $332 | |
| 203 20239 MICHAUD CRESCENT | $336,000 | $385,000 | -12.73 | $350,000 | 20-Sep-2019 | 1996 | 17-Oct-2019 | 1,038 | $323 | |
| 104 5700 200 STREET | $290,000 | $349,900 | -17.12 | $296,000 | 15-Oct-2019 | 1984 | 19-Oct-2019 | 999 | $290 | |
| 110 8258 207A STREET | $520,000 | $531,000 | -2.07 | $534,900 | 25-Sep-2019 | 2014 | 20-Oct-2019 | 1,028 | $505 | |
| 229 8915 202 STREET | $445,000 | $470,000 | -5.32 | $469,900 | 06-Sep-2019 | 2009 | 21-Oct-2019 | 961 | $463 |
30 out of 34 sold below assessed with a median sold price of -7.22
Maple Ridge
| Address | Sold Price | Assessed | % Δ | True List Price | True List Date | Year Built | Sold Date | Sqft | Price per sqft | Notes |
|---|---|---|---|---|---|---|---|---|---|---|
| 7 21555 DEWDNEY TRUNK ROAD | $224,000 | $199,600 | 12.22 | $235,000 | 18-Sep-2019 | 1970 | 05-Oct-2019 | 548 | $408 | Renovated/updated. |
| 407 12238 224 STREET | $379,000 | $404,000 | -6.19 | $409,000 | 28-Aug-2019 | 2007 | 07-Oct-2019 | 854 | $443 | |
| 206 22858 LOUGHEED HIGHWAY | $268,800 | $310,000 | -13.29 | $310,000 | 19-Jun-2019 | 2010 | 08-Oct-2019 | 625 | $430 | |
| 712 12148 224 STREET | $540,000 | $528,000 | 2.27 | $595,000 | 04-Sep-2019 | 1999 | 09-Oct-2019 | 1,302 | $414 | Renovated/updated. |
| 206 11605 227 STREET | $353,500 | $363,300 | -2.70 | $424,900 | 10-Jul-2019 | 1993 | 11-Oct-2019 | 1,036 | $341 | Renovated/updated. |
| 307 11580 223 STREET | $327,900 | $307,000 | 6.81 | $330,000 | 05-Aug-2019 | 2014 | 11-Oct-2019 | 752 | $436 | |
| 207 12090 227 STREET | $417,500 | $483,000 | -13.56 | $459,000 | 18-Mar-2019 | 2005 | 12-Oct-2019 | 983 | $424 | |
| 124 12248 224 STREET | $394,500 | $414,000 | -4.71 | $399,000 | 10-Sep-2019 | 2007 | 13-Oct-2019 | 962 | $410 | |
| 203 22363 SELKIRK AVENUE | $338,000 | $400,000 | -15.50 | $364,900 | 02-Apr-2019 | 2007 | 15-Oct-2019 | 849 | $398 | |
| 302 22327 RIVER ROAD | $348,000 | $366,000 | -4.92 | $369,000 | 30-Aug-2019 | 2015 | 16-Oct-2019 | 625 | $556 | |
| 107 11963 223 STREET | $322,500 | $334,300 | -3.53 | $329,900 | 30-Sep-2019 | 1990 | 18-Oct-2019 | 1,059 | $304 |
8 out of 11 sold below assessed with a median sold price of -4.71
White Rock
| Address | Sold Price | Assessed | % Δ | True List Price | True List Date | Year Built | Sold Date | Sqft | Price per sqft | Notes |
|---|---|---|---|---|---|---|---|---|---|---|
| 301 1331 FOSTER STREET | $403,500 | $564,300 | -28.50 | $430,000 | 25-Sep-2019 | 1974 | 02-Oct-2019 | 1,274 | $316 | Renovated/updated. |
| 201 1526 GEORGE STREET | $357,000 | $364,500 | -2.06 | $389,000 | 25-Apr-2019 | 1979 | 03-Oct-2019 | 898 | $397 | Renovated/updated. |
| 106 14950 THRIFT AVENUE | $335,000 | $364,000 | -7.97 | $473,000 | 31-May-2018 | 1986 | 05-Oct-2019 | 1,053 | $318 | Renovated/updated. |
| 3E 1400 GEORGE STREET | $430,000 | $501,000 | -14.17 | $499,000 | 03-Sep-2019 | 1990 | 06-Oct-2019 | 1,299 | $331 | |
| 502 1581 FOSTER STREET | $590,000 | $768,000 | -23.18 | $679,000 | 15-Jul-2019 | 2004 | 06-Oct-2019 | 1,441 | $409 | |
| 406 1581 FOSTER STREET | $575,000 | $596,000 | -3.52 | $599,000 | 23-Aug-2019 | 2004 | 07-Oct-2019 | 1,277 | $450 | |
| 201 1501 VIDAL STREET | $910,000 | $1,092,000 | -16.67 | $1,075,000 | 29-Aug-2018 | 2017 | 10-Oct-2019 | 1,289 | $705 | |
| 1806 15152 RUSSELL AVENUE | $635,000 | $738,000 | -13.96 | $689,000 | 01-Oct-2019 | 2009 | 10-Oct-2019 | 958 | $662 | |
| 404 1480 FOSTER STREET | $317,000 | $386,000 | -17.88 | $399,900 | 08-Apr-2019 | 1976 | 11-Oct-2019 | 833 | $380 | |
| 312 1119 VIDAL STREET | $493,000 | $604,000 | -18.38 | $579,500 | 11-Sep-2019 | 1996 | 15-Oct-2019 | 1,045 | $471 | Renovated/updated. |
| 204 1441 BLACKWOOD STREET | $465,000 | $418,000 | 11.24 | $519,000 | 18-Mar-2019 | 1988 | 16-Oct-2019 | 1,140 | $407 | Renovated/updated. |
| 307 15941 MARINE DRIVE | $520,000 | $589,000 | -11.71 | $525,000 | 25-Sep-2019 | 1992 | 19-Oct-2019 | 1,157 | $449 | Renovated/updated. |
11 out of 12 sold below assessed with a median sold price of -14.06
OpenHousing Home Price Index covers Vancouver, Richmond, Burnaby, West Vancouver, New Westminster, North Vancouver, Delta, Surrey, Port Moody, Coquitlam, Port Coquitlam, Pitt Meadows, Maple Ridge, Lions Bay, Bower Island, Anmore, and Belcarra, Langley and White Rock. Data for Vancouver also include University British Columbia and University Endowment Lands.
Its very nice to see these very detailed numbers. How do you aggrege the data?