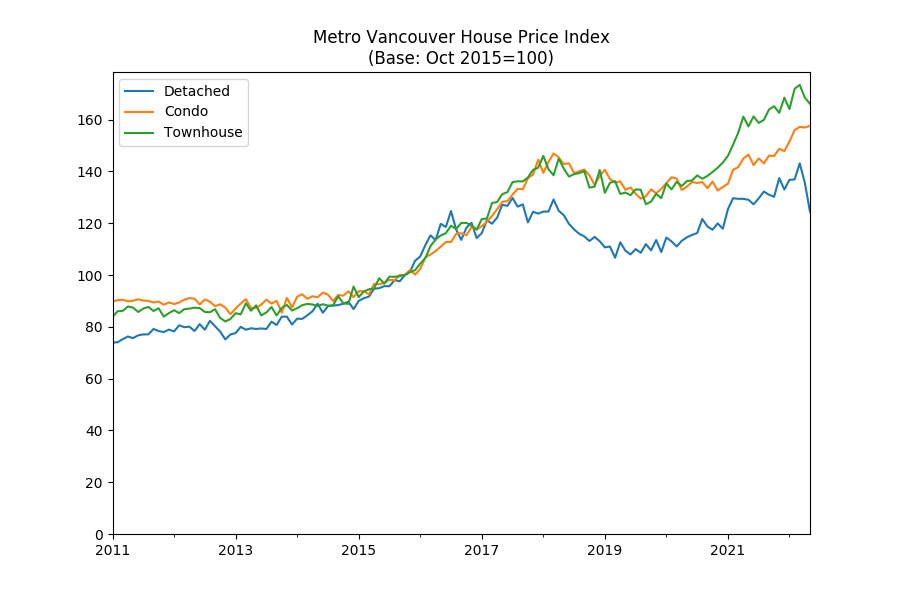
Metro Vancouver townhouse prices saw another monthly decline in May 2022, following a similar month-over-month decline in April.
The OpenHousing Home Price Index for townhouse properties – calculated using the generally-accepted and transparent repeat sales or Case-Shiller method – rose 5.54% year-over-year, the May month-end update shows. This represents a decrease of 1.39% compared to April.
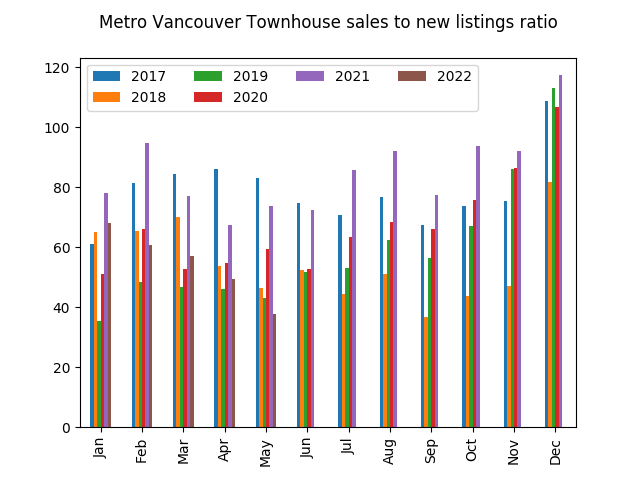
The sales to new listings (SNL) ratio for townhouses stands at 38, indicating a buyers market.
The OpenHousing Home Price Index covers Vancouver, Richmond, Burnaby, West Vancouver, New Westminster, North Vancouver, Delta, Surrey, Port Moody, Coquitlam, Port Coquitlam, Pitt Meadows, Maple Ridge, Lions Bay, Bower Island, Anmore, and Belcarra, Langley and White Rock. Data for Vancouver also include University British Columbia and University Endowment Lands.
Here’s what townhouse sales looked like in the last 30 days.
Vancouver
Address
Sold Price
Assessed
% Δ
True List Price
True List Date
Year Built
Sold Date
Sqft
Price per sqft
Notes
6010 PRINCE EDWARD STREET
$1,210,000
$1,068,000
13.30
$1,128,000
04-May-2022
2013
08-May-2022
1,090
$1,110
5498 DUNDEE STREET
$1,160,000
$958,000
21.09
$997,000
29-Jul-2016
2016
08-May-2022
1,130
$1,026
7250 APPLEDALE PLACE
$790,000
$832,000
-5.05
$849,000
25-Apr-2022
1979
09-May-2022
1,836
$430
8420 MILLSTONE STREET
$950,000
$874,000
8.70
?
28-May-2012
1994
09-May-2022
1,430
$664
979 EXPO BOULEVARD
$847,000
$837,000
1.19
$899,000
03-Jan-2022
2005
09-May-2022
795
$1,065
3718 WINDSOR STREET
$1,375,000
$1,352,000
1.70
$1,729,000
27-Sep-2021
2021
09-May-2022
1,478
$930
4041 SPRINGTREE DRIVE
$1,508,000
$1,326,000
13.73
$1,498,000
27-Apr-2022
1978
09-May-2022
1,903
$792
Renovated/updated.
10 1966 YORK AVENUE
$1,351,000
$1,253,000
7.82
$1,248,000
03-May-2022
1988
09-May-2022
1,126
$1,199
101 657 W 7TH AVENUE
$1,025,000
$969,000
5.78
$999,000
03-May-2022
1996
10-May-2022
893
$1,147
Renovated/updated.
9 43 E 20TH AVENUE
$1,575,000
$1,204,000
30.81
$1,199,800
02-May-2022
1988
10-May-2022
1,302
$1,209
Renovated/updated.
307 1166 W 6TH AVENUE
$1,040,000
$808,000
28.71
$988,000
02-May-2022
1986
11-May-2022
905
$1,149
Renovated/updated.
8148 RIEL PLACE
$740,000
$723,000
2.35
$699,000
02-May-2022
1980
11-May-2022
1,802
$410
714 MILLYARD
$610,000
$851,000
-28.32
$599,000
11-May-2022
1976
12-May-2022
1,049
$581
Renovated/updated.
850 GREENCHAIN
$1,188,000
$1,303,000
-8.83
$1,188,000
04-May-2022
1976
12-May-2022
1,441
$824
3429 AMBERLY PLACE
$700,000
$656,000
6.71
$829,900
01-Mar-2022
1992
12-May-2022
1,760
$397
1977 W 13TH AVENUE
$1,320,000
$1,379,000
-4.28
$1,379,000
06-Apr-2022
1912
13-May-2022
1,306
$1,010
Renovated/updated.
111 5955 BIRNEY AVENUE
$1,260,000
$1,107,000
13.82
?
15-May-2015
2012
13-May-2022
1,200
$1,050
268 E 6TH AVENUE
$806,000
$708,000
13.84
$798,000
11-May-2022
2012
16-May-2022
707
$1,140
3718 WELWYN STREET
$1,650,000
$1,407,000
17.27
$1,499,000
10-May-2022
2006
17-May-2022
1,615
$1,021
3206 PERROT MEWS
$1,272,000
$1,149,000
10.70
$1,188,000
09-May-2022
2004
17-May-2022
1,464
$868
31 3036 W 4TH AVENUE
$1,241,000
$1,003,000
23.73
$1,169,000
09-May-2022
1998
17-May-2022
1,021
$1,215
Renovated/updated.
108 2688 VINE STREET
$1,380,000
$1,213,000
13.77
$1,398,000
13-Jan-2022
1998
17-May-2022
1,067
$1,293
8 2717 HORLEY STREET
$1,200,000
$1,113,000
7.82
$1,099,000
12-May-2022
2019
18-May-2022
1,132
$1,060
2522 W 8TH AVENUE
$2,238,000
$1,855,000
20.65
$2,248,800
13-May-2022
2012
19-May-2022
1,886
$1,186
266 E 2ND AVENUE
$782,000
$690,000
13.33
$799,900
10-May-2022
2009
19-May-2022
726
$1,077
1560 COMOX STREET
$1,990,000
$1,854,000
7.34
$2,089,000
09-May-2022
2011
19-May-2022
1,764
$1,128
Renovated/updated.
2949 LAUREL STREET
$1,740,000
$1,593,000
9.23
$1,698,000
16-May-2022
2004
20-May-2022
1,403
$1,240
1080 W 7TH AVENUE
$2,999,000
$2,971,000
0.94
$3,299,000
14-Feb-2022
2012
21-May-2022
2,291
$1,309
Renovated/updated.
3 3130 W 4TH AVENUE
$1,020,000
$891,000
14.48
$988,888
16-May-2022
1999
21-May-2022
869
$1,173
Renovated/updated.
2766 W 1ST AVENUE
$1,850,000
$1,571,000
17.76
$1,850,000
18-May-2022
1975
23-May-2022
1,332
$1,388
Renovated/updated.
1216 ISLAND PARK WALK
$1,390,000
$1,155,000
20.35
$1,388,000
25-Apr-2022
1980
23-May-2022
1,187
$1,171
Renovated/updated.
108 5955 BIRNEY AVENUE
$1,399,900
$1,147,000
22.05
$1,428,800
13-Apr-2022
2012
24-May-2022
1,214
$1,153
417 E 6TH AVENUE
$1,636,000
$1,554,000
5.28
$1,428,000
24-May-2016
2017
24-May-2022
1,471
$1,112
1517 ATLAS LANE
$1,478,000
$1,494,000
-1.07
$1,599,000
30-Oct-2019
2015
24-May-2022
1,300
$1,136
2449 POINT GREY ROAD
$3,875,000
$2,833,000
36.78
$4,198,000
19-Apr-2022
1925
24-May-2022
1,476
$2,625
Renovated/updated.
3427 LYNMOOR PLACE
$795,000
$742,000
7.14
$749,900
17-May-2022
1982
24-May-2022
1,269
$626
Renovated/updated.
605 W 31ST AVENUE
$2,150,000
$2,114,000
1.70
$2,399,900
06-Apr-2022
2021
24-May-2022
1,748
$1,229
1902 STEPHENS STREET
$1,579,000
$1,819,000
-13.19
?
23-Sep-2014
1980
25-May-2022
1,500
$1,052
2226 WILLOW STREET
$1,605,000
$1,479,000
8.52
?
24-Feb-2014
2013
25-May-2022
1,391
$1,153
29 4311 SOPHIA STREET
$1,417,500
$1,341,000
5.70
$1,398,000
17-May-2022
1988
25-May-2022
1,304
$1,087
Renovated/updated.
5 1250 W 6TH AVENUE
$1,065,000
$1,009,000
5.55
$1,049,800
24-May-2022
2003
26-May-2022
959
$1,110
7231 QUATSINO DRIVE
$932,500
$873,000
6.82
$939,900
24-May-2022
1981
30-May-2022
1,568
$594
4527 PRINCE ALBERT STREET
$1,560,000
$1,427,000
9.32
$1,499,000
24-May-2022
2011
30-May-2022
1,418
$1,100
Renovated/updated.
3665 WINDSOR STREET
$1,230,000
$1,366,000
-9.96
$1,298,000
09-May-2022
2009
30-May-2022
1,034
$1,189
Renovated/updated.
3436 LYNMOOR PLACE
$807,000
$750,000
7.60
$749,900
24-May-2022
1982
31-May-2022
1,259
$640
Renovated/updated.
264 E 6TH AVENUE
$780,000
$707,000
10.33
$699,000
19-May-2022
2012
31-May-2022
712
$1,095
Richmond
Address
Sold Price
Assessed
% Δ
True List Price
True List Date
Year Built
Sold Date
Sqft
Price per sqft
Notes
31 9688 KEEFER AVENUE
$1,176,000
$952,000
23.53
$990,000
19-Apr-2022
2008
08-May-2022
1,490
$789
72 6245 SHERIDAN ROAD
$1,286,890
$964,000
33.49
$999,999
02-May-2022
1995
09-May-2022
1,957
$657
Renovated/updated.
36 10311 RIVER DRIVE
$1,468,000
$1,137,000
29.11
$1,495,000
25-Apr-2022
2020
09-May-2022
1,535
$956
Renovated/updated.
17 8300 JONES ROAD
$1,208,000
$929,000
30.03
$999,000
02-May-2022
1994
10-May-2022
1,575
$766
Renovated/updated.
28 9800 ODLIN ROAD
$1,370,000
$1,204,000
13.79
$1,299,000
02-May-2022
2008
10-May-2022
1,836
$746
12 8480 BLUNDELL ROAD
$1,018,000
$750,000
35.73
$899,000
05-May-2022
1989
10-May-2022
1,229
$828
Renovated/updated.
6 12311 NO 2 ROAD
$1,478,000
$1,244,000
18.81
$1,499,900
04-May-2022
2006
10-May-2022
1,782
$829
102 4900 FRANCIS ROAD
$861,000
$799,400
7.71
$899,000
02-May-2022
1977
11-May-2022
1,377
$625
Renovated/updated.
9 8660 NO 3 ROAD
$1,302,000
$1,095,000
18.90
$1,190,000
02-May-2022
2006
11-May-2022
1,539
$846
32 7611 MOFFATT ROAD
$910,000
$870,000
4.60
$930,000
05-Apr-2022
1985
12-May-2022
1,596
$570
106 9080 NO. 3 ROAD
$1,273,900
$1,063,000
19.84
$1,288,000
21-Apr-2022
2018
14-May-2022
1,379
$923
4 9840 ALBERTA ROAD
$1,220,000
$1,021,000
19.49
$1,188,000
22-Mar-2022
2016
14-May-2022
1,407
$867
40 12891 JACK BELL DRIVE
$1,135,000
$949,000
19.60
$1,088,890
07-Apr-2022
1994
14-May-2022
1,490
$761
23 9551 FERNDALE ROAD
$1,118,000
$950,000
17.68
$988,000
03-May-2022
2007
15-May-2022
1,362
$820
10 8091 WILLIAMS ROAD
$1,320,000
$1,016,000
29.92
$1,190,000
10-May-2022
2012
16-May-2022
1,425
$926
32 22788 WESTMINSTER HIGHWAY
$750,000
$665,000
12.78
$738,000
10-May-2022
2009
16-May-2022
1,126
$666
34 3851 BLUNDELL ROAD
$836,000
$735,500
13.66
$875,000
25-Apr-2022
1976
16-May-2022
1,323
$631
Renovated/updated.
3 6611 PEARSON WAY
$1,450,000
$1,199,000
20.93
$1,588,800
25-Mar-2019
2018
16-May-2022
1,424
$1,018
15 10200 4TH AVENUE
$640,000
$599,900
6.68
$649,900
10-May-2022
1971
17-May-2022
1,326
$482
78 6588 BARNARD DRIVE
$1,033,000
$848,000
21.82
$998,000
25-Apr-2022
1996
17-May-2022
1,430
$722
22 5988 LANCING ROAD
$1,060,000
$982,000
7.94
?
10-Oct-2011
2005
17-May-2022
1,581
$670
9 7680 GILBERT ROAD
$1,218,000
$983,000
23.91
$1,188,000
05-Apr-2022
1989
17-May-2022
2,065
$589
Renovated/updated.
11652 KINGSBRIDGE DRIVE
$630,000
$487,200
29.31
$498,000
09-May-2022
1977
17-May-2022
1,060
$594
Renovated/updated.
36 12251 NO. 2 ROAD
$1,132,000
$898,000
26.06
$1,138,800
13-May-2022
2007
18-May-2022
1,348
$839
24 7393 TURNILL STREET
$1,060,000
$939,000
12.89
$999,000
09-May-2022
2009
21-May-2022
1,450
$731
60 3900 MORESBY DRIVE
$660,000
$606,500
8.82
$1,000,000
22-Oct-2017
1974
22-May-2022
1,366
$483
25 6300 LONDON ROAD
$990,000
$792,000
25.00
$858,000
12-May-2022
2005
23-May-2022
1,142
$866
211 8140 COLONIAL DRIVE
$600,000
$427,200
40.45
$499,000
05-May-2022
1977
23-May-2022
908
$660
Renovated/updated.
11 9733 NO 2 ROAD
$1,288,000
$1,061,000
21.39
$1,280,000
16-May-2022
2009
24-May-2022
1,394
$923
Renovated/updated.
19 6033 WILLIAMS ROAD
$1,090,000
$988,000
10.32
$1,190,000
16-May-2022
2015
24-May-2022
1,200
$908
52 9333 SILLS AVENUE
$1,150,800
$967,000
19.01
$1,168,000
09-May-2022
2005
25-May-2022
1,706
$674
127 3333 BROWN ROAD
$945,000
$886,000
6.66
$899,900
14-Mar-2022
2017
26-May-2022
1,276
$740
38 7331 HEATHER STREET
$1,000,000
$862,000
16.01
$889,000
13-May-2022
2005
26-May-2022
1,210
$826
6 6675 NO. 2 ROAD
$1,073,000
$805,000
33.29
$959,900
26-May-2022
1990
31-May-2022
1,761
$609
Renovated/updated.
Burnaby
Address
Sold Price
Assessed
% Δ
True List Price
True List Date
Year Built
Sold Date
Sqft
Price per sqft
Notes
66 7088 17TH AVENUE
$785,000
$676,000
16.12
$788,000
03-May-2022
2004
08-May-2022
912
$860
8 7551 HUMPHRIES COURT
$750,000
$661,900
13.31
$699,000
08-Feb-2022
1978
08-May-2022
1,252
$599
252 7333 16TH AVENUE
$700,000
$619,000
13.09
$728,000
25-Apr-2022
2007
09-May-2022
940
$744
Renovated/updated.
8553 WILDERNESS COURT
$1,203,000
$892,600
34.77
$1,049,000
02-May-2022
1981
09-May-2022
1,839
$654
Renovated/updated.
7 5122 CANADA WAY
$1,015,000
$877,000
15.74
$1,099,000
19-Apr-2022
2018
10-May-2022
1,183
$857
Renovated/updated.
77 9229 UNIVERSITY CRESCENT
$655,000
$633,000
3.48
$650,000
02-May-2022
2006
10-May-2022
1,094
$598
Renovated/updated.
3 5228 SAVILE ROW
$1,180,000
$942,000
25.27
$938,000
15-Aug-2018
2018
10-May-2022
1,160
$1,017
Renovated/updated.
10 3855 PENDER STREET
$1,107,000
$925,000
19.68
$988,000
02-May-2022
2004
11-May-2022
1,068
$1,036
Renovated/updated.
15 7071 EDMONDS STREET
$700,000
$581,000
20.48
$588,000
01-Jul-2020
1999
12-May-2022
928
$754
57 6868 BURLINGTON AVENUE
$1,140,000
$914,000
24.73
$1,150,000
04-May-2022
2013
12-May-2022
1,339
$851
232 3888 NORFOLK STREET
$896,000
$866,000
3.46
$899,000
10-May-2022
2011
15-May-2022
1,202
$745
50 7520 18TH STREET
$790,000
$669,000
18.09
$699,000
06-May-2022
1992
16-May-2022
1,156
$683
Renovated/updated.
3 5122 CANADA WAY
$1,035,000
$865,000
19.65
$819,000
06-Apr-2020
2018
16-May-2022
1,158
$893
Renovated/updated.
77 5950 OAKDALE ROAD
$1,400,000
$1,178,000
18.85
$1,299,000
09-May-2022
1994
16-May-2022
1,840
$760
8808 FINCH COURT
$908,000
$757,700
19.84
$849,000
09-May-2022
1987
16-May-2022
1,429
$635
Renovated/updated.
11 7039 MACPHERSON AVENUE
$1,220,000
$1,066,000
14.45
$1,199,000
09-May-2022
2016
16-May-2022
1,617
$754
3957 CREEKSIDE PLACE
$1,250,000
$896,000
39.51
$988,000
11-May-2022
1985
16-May-2022
1,735
$720
113 4255 SARDIS STREET
$615,000
$537,000
14.53
$599,000
11-May-2022
2013
17-May-2022
602
$1,021
32 7039 MACPHERSON AVENUE
$800,000
$719,000
11.27
$818,000
09-May-2022
2016
17-May-2022
858
$932
53 6528 DENBIGH AVENUE
$620,000
$584,000
6.16
$680,000
09-Mar-2022
2004
17-May-2022
905
$685
9213 CAMERON STREET
$1,265,000
$1,035,000
22.22
$1,295,000
09-May-2022
2003
18-May-2022
1,664
$760
Renovated/updated.
16 6588 SOUTHOAKS CRESCENT
$775,000
$707,000
9.62
$795,000
17-May-2022
1997
23-May-2022
1,088
$712
57 7488 MULBERRY PLACE
$1,320,000
$931,000
41.78
$929,000
05-Aug-2019
1998
24-May-2022
1,716
$769
Renovated/updated.
8218 FOREST GROVE DRIVE
$1,175,000
$919,000
27.86
$1,175,000
13-May-2022
1984
25-May-2022
2,398
$489
Renovated/updated.
107 8485 NEW HAVEN CLOSE
$1,380,000
$1,101,000
25.34
$1,299,900
19-May-2022
2011
28-May-2022
1,682
$820
13 6708 ARCOLA STREET
$780,000
$744,000
4.84
$879,000
09-May-2022
2008
29-May-2022
1,216
$641
West Vancouver
Address
Sold Price
Assessed
% Δ
True List Price
True List Date
Year Built
Sold Date
Sqft
Price per sqft
Notes
1750 DUCHESS AVENUE
$1,810,000
$1,160,000
56.03
$1,799,000
19-May-2022
1980
26-May-2022
1,963
$922
Renovated/updated.
New Westminster
Address
Sold Price
Assessed
% Δ
True List Price
True List Date
Year Built
Sold Date
Sqft
Price per sqft
Notes
270 CAMATA STREET
$1,005,000
$838,000
19.93
$899,900
19-Apr-2022
2014
09-May-2022
1,435
$700
103 340 GINGER DRIVE
$610,000
$471,000
29.51
$588,000
03-May-2022
1986
10-May-2022
1,135
$537
Renovated/updated.
50 430 DUNCAN STREET
$1,012,000
$861,000
17.54
$998,000
09-May-2022
2020
16-May-2022
1,533
$660
206 828 ROYAL AVENUE
$750,000
$640,000
17.19
$720,000
10-May-2022
2012
17-May-2022
967
$775
16 240 JARDINE STREET
$998,900
$808,000
23.63
$998,900
10-May-2022
2017
17-May-2022
1,493
$669
21 838 ROYAL AVENUE
$545,000
$460,000
18.48
$525,000
09-May-2022
2013
27-May-2022
649
$839
229 600 PARK CRESCENT
$850,000
$715,000
18.88
$749,000
24-May-2022
2003
31-May-2022
1,148
$740
Renovated/updated.
North Vancouver
Address
Sold Price
Assessed
% Δ
True List Price
True List Date
Year Built
Sold Date
Sqft
Price per sqft
Notes
1140 PREMIER STREET
$1,252,000
$867,000
44.41
$1,098,000
02-May-2022
1970
10-May-2022
1,702
$735
Renovated/updated.
1062 LILLOOET ROAD
$930,000
$946,600
-1.75
$1,050,000
04-Apr-2022
1972
13-May-2022
1,939
$479
Renovated/updated.
5 1960 GLENAIRE DRIVE
$1,820,000
$1,943,000
-6.33
$1,689,900
30-Jul-2020
2020
15-May-2022
2,066
$880
232 735 W 15TH STREET
$1,140,000
$1,052,000
8.37
$1,170,000
02-Mar-2022
2011
15-May-2022
1,019
$1,118
280 E 5TH STREET
$1,868,900
$1,373,000
36.12
$1,868,900
10-May-2022
1997
15-May-2022
1,728
$1,081
1167 HERITAGE BOULEVARD
$1,300,000
$1,213,000
7.17
$1,278,000
09-May-2022
1973
17-May-2022
2,190
$593
Renovated/updated.
218 E 10TH STREET
$1,338,000
$1,079,000
24.00
$1,199,000
09-May-2022
1996
17-May-2022
1,332
$1,004
Renovated/updated.
902 555 W 28TH STREET
$850,000
$720,400
17.99
$819,000
10-May-2022
1968
17-May-2022
1,177
$722
Renovated/updated.
3125 SUNNYHURST ROAD
$1,625,000
$1,517,000
7.12
$1,499,000
10-May-2022
2008
17-May-2022
1,978
$821
2534 WESTERN AVENUE
$1,188,000
$1,013,000
17.28
$1,188,000
11-May-2022
1996
18-May-2022
1,306
$909
12 251 E 11TH STREET
$1,725,000
$1,250,000
38.00
$1,998,000
21-Apr-2022
1997
18-May-2022
2,015
$856
Renovated/updated.
42 1550 LARKHALL CRESCENT
$1,768,000
$1,623,000
8.93
$1,699,000
09-May-2022
1994
18-May-2022
2,157
$819
1971 CEDAR VILLAGE CRESCENT
$1,666,840
$1,509,000
10.46
$1,678,680
16-May-2022
1982
20-May-2022
2,957
$563
Renovated/updated.
22 4055 INDIAN RIVER DRIVE
$1,532,100
$1,246,000
22.96
$1,699,000
16-May-2022
1991
23-May-2022
2,547
$601
Renovated/updated.
152A W 18TH STREET
$745,000
$704,000
5.82
$710,000
16-May-2022
1982
23-May-2022
1,077
$691
1 1015 LYNN VALLEY ROAD
$885,000
$825,000
7.27
$889,000
23-May-2022
2001
26-May-2022
951
$930
Renovated/updated.
31 757 ORWELL STREET
$1,385,000
$1,241,000
11.60
$1,439,000
21-Apr-2022
2016
27-May-2022
1,404
$986
116 735 W 15TH STREET
$999,000
$918,000
8.82
$999,000
24-May-2022
2011
28-May-2022
946
$1,056
1325 CIVIC PLACE MEWS
$1,280,000
$1,113,000
15.00
$1,199,000
24-May-2022
2009
30-May-2022
1,286
$995
Renovated/updated.
44 728 W 14TH STREET
$933,000
$811,000
15.04
$799,000
24-May-2022
2007
01-Jun-2022
977
$954
1 2133 ST. GEORGES AVENUE
$1,400,000
$1,125,000
24.44
$1,298,000
31-May-2022
1989
01-Jun-2022
1,658
$844
106 245 W 15TH STREET
$1,550,000
$1,160,000
33.62
$1,399,000
26-May-2022
1992
01-Jun-2022
1,644
$942
Renovated/updated.
Delta
Address
Sold Price
Assessed
% Δ
True List Price
True List Date
Year Built
Sold Date
Sqft
Price per sqft
Notes
5640 16 AVENUE
$625,000
$589,000
6.11
$675,000
19-Apr-2022
1986
08-May-2022
1,118
$559
105 5900 FERRY ROAD
$1,435,000
$1,210,000
18.60
$1,310,000
03-May-2022
1998
10-May-2022
2,183
$657
Renovated/updated.
19 6429 MARKET AVENUE
$1,450,000
$1,098,000
32.06
$1,380,000
10-May-2022
2020
11-May-2022
1,948
$744
38 10735 84 AVENUE
$900,000
$703,000
28.02
$958,000
09-May-2022
2015
17-May-2022
1,450
$620
34 4787 57 STREET
$915,000
$762,000
20.08
$849,900
11-May-2022
2003
17-May-2022
1,543
$593
14 6280 48A AVENUE
$828,800
$857,000
-3.29
$828,800
12-May-2022
1992
17-May-2022
1,805
$459
85 5550 ADMIRAL WAY
$1,010,000
$921,000
9.66
$999,999
09-May-2022
2016
19-May-2022
1,428
$707
Surrey
Address
Sold Price
Assessed
% Δ
True List Price
True List Date
Year Built
Sold Date
Sqft
Price per sqft
Notes
1802 10620 150 STREET
$601,000
$421,500
42.59
$398,900
12-Nov-2020
1980
08-May-2022
966
$622
Renovated/updated.
131 16080 82 AVENUE
$1,045,000
$794,000
31.61
$1,100,000
28-Mar-2022
1991
08-May-2022
1,886
$554
4 14223 18A AVENUE
$729,000
$601,900
21.12
$729,000
04-May-2022
1983
08-May-2022
924
$788
11 16433 19 AVENUE
$950,000
$776,000
22.42
$999,999
07-Mar-2022
2019
08-May-2022
1,424
$667
202 7838 120A STREET
$923,000
$684,000
34.94
$799,999
15-Dec-2021
1990
08-May-2022
1,701
$542
Renovated/updated.
4 8257 121A STREET
$915,000
$707,000
29.42
$899,900
03-May-2022
1990
08-May-2022
1,573
$581
1405 18505 LAURENSEN PLACE
$1,050,000
$822,000
27.74
$998,000
04-May-2022
2017
08-May-2022
1,637
$641
50 3355 MORGAN CREEK WAY
$1,600,000
$1,341,000
19.31
$1,650,000
04-May-2022
1998
08-May-2022
3,591
$445
46 14541 WINTER CRESCENT
$860,000
$674,000
27.60
$829,900
05-May-2022
2021
08-May-2022
1,248
$689
16 15633 MOUNTAIN VIEW DRIVE
$1,300,000
$1,053,000
23.46
$1,399,000
27-Apr-2022
2018
08-May-2022
2,608
$498
Renovated/updated.
37 19330 69 AVENUE
$999,900
$820,000
21.94
$1,024,900
03-May-2022
2007
08-May-2022
2,000
$499
51 16433 19 AVENUE
$930,000
$767,000
21.25
$988,000
31-Mar-2022
2019
08-May-2022
1,400
$664
34 14877 58 AVENUE
$908,000
$743,000
22.21
$859,000
13-Apr-2022
1997
09-May-2022
1,694
$536
22 8560 162 STREET
$950,000
$775,000
22.58
$999,000
04-May-2022
1990
09-May-2022
1,857
$511
6276 W GREENSIDE DRIVE
$700,000
$598,300
17.00
$750,000
12-Apr-2022
1978
09-May-2022
1,166
$600
11 16685 25 AVENUE
$1,148,000
$771,000
48.90
$1,298,800
28-Mar-2022
2020
09-May-2022
1,659
$691
Renovated/updated.
111 13880 74 AVENUE
$666,600
$559,500
19.14
$649,000
04-May-2022
1978
09-May-2022
1,280
$520
Renovated/updated.
102 13858 102 AVENUE
$570,000
$397,400
43.43
$578,000
28-Apr-2022
1984
09-May-2022
1,334
$427
Renovated/updated.
35 15151 34 AVENUE
$920,000
$750,000
22.67
$899,000
04-May-2022
2006
09-May-2022
1,683
$546
4 2528 156 STREET
$925,000
$838,000
10.38
$988,000
26-Apr-2022
2017
09-May-2022
1,508
$613
6 13911 16 AVENUE
$1,075,000
$752,000
42.95
$1,098,000
28-Apr-2022
1993
09-May-2022
1,668
$644
31 16685 25 AVENUE
$938,000
$801,000
17.10
$1,100,000
21-Mar-2022
2020
10-May-2022
1,458
$643
Renovated/updated.
34 15450 101A AVENUE
$695,000
$597,000
16.42
$720,000
04-May-2022
1999
10-May-2022
1,217
$571
65 13880 74 AVENUE
$725,000
$598,400
21.16
$599,999
10-Nov-2021
1978
10-May-2022
1,329
$545
Renovated/updated.
2 6671 121 STREET
$835,000
$654,000
27.68
$788,000
04-May-2022
2009
10-May-2022
1,234
$676
181 18701 66 AVENUE
$888,000
$773,000
14.88
$899,900
29-Apr-2022
2005
10-May-2022
1,796
$494
17 6588 195A STREET
$999,999
$856,000
16.82
$1,099,000
04-Apr-2022
2013
10-May-2022
1,909
$523
Renovated/updated.
18 2450 161A STREET
$860,000
$746,000
15.28
$799,000
12-Apr-2022
2008
11-May-2022
1,380
$623
Renovated/updated.
1903 LILAC DRIVE
$720,000
$676,300
6.46
$799,000
26-Apr-2022
1979
11-May-2022
2,084
$345
Renovated/updated.
61 12036 66 AVENUE
$915,000
$703,000
30.16
$929,000
10-May-2022
2010
11-May-2022
1,396
$655
35 8111 160 STREET
$940,000
$740,000
27.03
$899,900
02-May-2022
1996
11-May-2022
1,643
$572
Renovated/updated.
47 19505 68A AVENUE
$740,000
$598,000
23.75
$824,900
28-Apr-2022
2011
11-May-2022
1,100
$672
49 3009 156 STREET
$875,000
$725,000
20.69
$899,999
30-Mar-2022
2010
11-May-2022
1,452
$602
Renovated/updated.
216 7837 120A STREET
$820,000
$674,000
21.66
$844,900
03-May-2022
1989
12-May-2022
1,760
$465
Renovated/updated.
35 8358 121A STREET
$990,000
$833,000
18.85
$1,000,000
28-Apr-2022
2008
12-May-2022
1,890
$523
117 16350 14 AVENUE
$901,000
$753,000
19.65
$949,900
14-Apr-2022
1987
12-May-2022
1,770
$509
103 15501 89A AVENUE
$850,000
$703,000
20.91
$859,000
04-May-2022
1990
12-May-2022
1,740
$488
21 5839 PANORAMA DRIVE
$685,000
$602,000
13.79
$729,800
08-Mar-2022
2003
12-May-2022
1,107
$618
102 15236 36 AVENUE
$832,000
$657,000
26.64
$835,000
10-May-2022
2003
12-May-2022
1,330
$625
27 16760 61 AVENUE
$1,100,000
$835,000
31.74
$1,100,000
03-Apr-2022
2002
12-May-2022
2,238
$491
87 16233 83 AVENUE
$850,000
$747,000
13.79
$875,000
26-Apr-2022
2006
12-May-2022
1,541
$551
93 8888 151 STREET
$940,000
$681,000
38.03
$1,199,000
25-Feb-2022
2000
12-May-2022
1,540
$610
Renovated/updated.
53 8555 KING GEORGE BOULEVARD
$648,800
$536,800
20.86
$749,900
04-Apr-2022
1978
12-May-2022
1,129
$574
Renovated/updated.
24 17516 4 AVENUE
$825,000
$767,000
7.56
$899,900
13-Apr-2022
2003
13-May-2022
1,297
$636
1 19505 68A AVENUE
$999,999
$839,000
19.19
$999,900
09-May-2022
2010
13-May-2022
1,855
$539
Renovated/updated.
18 15288 36 AVENUE
$1,500,000
$1,284,000
16.82
$1,099,000
26-Oct-2020
2003
13-May-2022
3,183
$471
Renovated/updated.
36 3039 156 STREET
$1,065,000
$915,000
16.39
$1,150,000
19-Apr-2022
2013
13-May-2022
1,828
$582
Renovated/updated.
17 10880 152 STREET
$785,000
$604,000
29.97
$799,900
07-Mar-2022
1971
13-May-2022
1,656
$474
75 8775 161 STREET
$680,000
$541,000
25.69
$699,900
27-Apr-2022
2000
14-May-2022
1,031
$659
10 14877 58 AVENUE
$945,000
$739,000
27.88
$999,800
02-May-2022
1997
14-May-2022
1,784
$529
Renovated/updated.
13 303 171 STREET
$1,129,000
$933,000
21.01
$1,129,000
09-May-2022
2018
14-May-2022
1,932
$584
9 10045 154 STREET
$815,000
$712,000
14.47
$850,000
16-Apr-2021
1989
14-May-2022
1,792
$454
8 6988 177 STREET
$1,399,000
$1,096,000
27.65
$1,399,000
12-May-2022
2011
14-May-2022
3,323
$421
Renovated/updated.
90 18221 68 AVENUE
$880,000
$657,000
33.94
$914,900
02-May-2022
2000
15-May-2022
1,387
$634
Renovated/updated.
52 2678 KING GEORGE BOULEVARD
$820,000
$699,000
17.31
$799,000
14-Mar-2022
1997
15-May-2022
1,403
$584
Renovated/updated.
79 18221 68 AVENUE
$900,000
$664,000
35.54
$995,000
21-Mar-2022
2000
15-May-2022
1,434
$627
Renovated/updated.
49 15959 82 AVENUE
$975,000
$791,000
23.26
$1,200,000
14-Mar-2022
1996
15-May-2022
2,267
$430
2301 10620 150 STREET
$550,000
$435,700
26.23
$499,000
09-May-2022
1980
15-May-2022
1,013
$542
49 8355 164 STREET
$890,000
$698,000
27.51
$875,000
10-May-2022
2012
15-May-2022
1,459
$610
Renovated/updated.
11 6033 168 STREET
$799,900
$650,000
23.06
$799,900
11-Apr-2022
2006
15-May-2022
1,410
$567
35 17706 60 AVENUE
$475,000
$336,600
41.12
$449,900
11-May-2022
1973
15-May-2022
980
$484
39 13886 62 AVENUE
$894,000
$695,000
28.63
$969,000
04-May-2022
2013
15-May-2022
1,554
$575
76 7155 189 STREET
$679,000
$579,000
17.27
$799,000
06-Apr-2022
2005
15-May-2022
1,209
$561
42 15885 26 AVENUE
$1,499,000
$1,126,000
33.13
$1,499,000
19-Apr-2022
2008
15-May-2022
3,477
$431
22 15850 85 AVENUE
$935,000
$680,000
37.50
$1,000,000
25-Apr-2022
2020
16-May-2022
1,390
$672
19 9718 161A STREET
$840,000
$661,000
27.08
$849,980
02-May-2022
2019
16-May-2022
1,244
$675
24 1828 LILAC DRIVE
$863,500
$605,000
42.73
$839,000
12-May-2022
1996
16-May-2022
1,652
$522
Renovated/updated.
120 9177 154 STREET
$780,000
$629,000
24.01
$820,000
04-May-2022
1989
16-May-2022
1,574
$495
101 12135 78 AVENUE
$780,000
$565,000
38.05
$579,000
29-Jul-2020
1990
16-May-2022
1,267
$615
326 13888 70 AVENUE
$750,000
$633,000
18.48
$799,888
06-May-2022
1994
16-May-2022
1,973
$380
Renovated/updated.
34 6378 142 STREET
$1,025,000
$743,000
37.95
$1,049,000
03-Mar-2022
2013
16-May-2022
1,790
$572
72 14655 32 AVENUE
$1,448,000
$1,139,000
27.13
$1,448,000
27-Apr-2022
2007
16-May-2022
2,695
$537
45 12165 75 AVENUE
$945,000
$729,000
29.63
$929,000
11-May-2022
1994
16-May-2022
1,671
$565
6023 W GREENSIDE DRIVE
$775,000
$593,100
30.67
?
15-Apr-2012
1978
16-May-2022
1,254
$618
6 17516 4 AVENUE
$810,000
$730,000
10.96
$849,000
12-Apr-2022
2003
16-May-2022
1,201
$674
21 7250 144 STREET
$879,000
$720,000
22.08
$942,999
11-Apr-2022
1999
16-May-2022
1,590
$552
76 15665 MOUNTAIN VIEW DRIVE
$1,260,000
$1,018,000
23.77
$1,399,000
22-Mar-2022
2019
17-May-2022
2,513
$501
152 2729 158 STREET
$818,000
$674,000
21.36
$788,000
09-May-2022
2009
17-May-2022
1,393
$587
14 15128 24 AVENUE
$900,000
$732,000
22.95
$899,900
12-May-2022
2014
17-May-2022
1,476
$609
88 2678 KING GEORGE BOULEVARD
$885,000
$708,000
25.00
$878,800
13-May-2022
1997
17-May-2022
1,700
$520
138 19525 73 AVENUE
$865,000
$736,000
17.53
$484,900
11-Jul-2016
2011
17-May-2022
1,509
$573
2 6929 142 STREET
$1,100,000
$803,000
36.99
$699,000
17-Aug-2018
2014
17-May-2022
1,925
$571
38 1670 160 STREET
$1,030,000
$788,000
30.71
$1,075,000
25-Apr-2022
2020
17-May-2022
1,367
$753
Renovated/updated.
28 6621 138 STREET
$648,000
$529,500
22.38
$639,000
13-May-2022
1978
17-May-2022
1,111
$583
Renovated/updated.
1 10282 132 STREET
$825,000
$673,000
22.59
$859,900
02-May-2022
2009
18-May-2022
1,496
$551
Renovated/updated.
1 7250 144 STREET
$853,000
$663,000
28.66
$890,000
02-May-2022
1999
18-May-2022
1,632
$522
Renovated/updated.
111 13900 HYLAND ROAD
$870,000
$724,000
20.17
$869,000
11-May-2022
1992
18-May-2022
1,807
$481
30 15977 26 AVENUE
$1,365,000
$1,046,000
30.50
$1,398,000
12-May-2022
2011
18-May-2022
2,434
$560
16 18181 68 AVENUE
$890,000
$687,000
29.55
$899,999
05-May-2022
2000
18-May-2022
1,491
$596
Renovated/updated.
32 16678 25 AVENUE
$940,000
$790,000
18.99
$998,000
15-Apr-2022
2019
18-May-2022
1,429
$657
14 1725 SOUTHMERE CRESCENT
$1,100,000
$995,000
10.55
$1,199,650
28-Apr-2022
1981
18-May-2022
2,253
$488
319 13888 70 AVENUE
$680,000
$606,000
12.21
$749,900
09-May-2022
1994
18-May-2022
1,581
$430
20 19551 66 AVENUE
$595,000
$492,000
20.93
$599,900
12-May-2022
2007
18-May-2022
889
$669
109 13670 62 AVENUE
$930,000
$677,000
37.37
$968,000
14-Mar-2022
2016
19-May-2022
1,530
$607
58 6945 185 STREET
$777,000
$660,000
17.73
$799,900
10-May-2022
2013
19-May-2022
1,455
$534
4 6767 196 STREET
$1,030,000
$849,000
21.32
$1,149,000
16-Mar-2022
2015
19-May-2022
2,000
$515
Renovated/updated.
38 13670 62 AVENUE
$900,000
$706,000
27.48
$999,000
09-Feb-2022
2016
19-May-2022
1,550
$580
97 18983 72A AVENUE
$785,000
$648,000
21.14
$799,900
09-May-2022
2007
19-May-2022
1,285
$610
50 19477 72A AVENUE
$725,000
$592,000
22.47
$740,000
11-May-2022
2012
20-May-2022
1,037
$699
57 7955 122 STREET
$857,700
$737,000
16.38
$857,700
16-May-2022
1989
20-May-2022
1,906
$450
Renovated/updated.
9 8111 160 STREET
$920,000
$739,000
24.49
$999,000
02-May-2022
1995
21-May-2022
1,649
$557
Renovated/updated.
16 9385 121 STREET
$787,000
$653,700
20.39
$798,000
11-May-2022
1974
21-May-2022
1,723
$456
Renovated/updated.
69 6671 121 STREET
$775,000
$653,000
18.68
$875,000
17-Mar-2022
2009
21-May-2022
1,235
$627
65 16655 64 AVENUE
$1,174,000
$970,000
21.03
$1,249,000
14-Apr-2022
2001
22-May-2022
2,813
$417
Renovated/updated.
3 1820 SOUTHMERE CRESCENT
$1,063,000
$922,000
15.29
$1,100,000
10-May-2022
1985
22-May-2022
1,790
$593
Renovated/updated.
5 8111 160 STREET
$955,000
$739,000
29.23
$978,900
17-May-2022
1995
22-May-2022
1,670
$571
93 18701 66 AVENUE
$700,000
$642,000
9.03
$729,900
11-May-2022
2005
23-May-2022
1,315
$532
30 6110 138 STREET
$875,000
$692,000
26.45
$798,980
02-May-2022
2005
23-May-2022
1,604
$545
23 3399 151 STREET
$872,500
$752,000
16.02
$878,800
02-May-2022
2013
23-May-2022
1,279
$682
22 16655 64 AVENUE
$920,000
$818,000
12.47
$1,000,000
13-May-2022
2001
23-May-2022
1,868
$492
29 9922 148 STREET
$519,000
$410,500
26.43
$439,000
17-May-2022
1986
24-May-2022
1,250
$415
7 13660 84 AVENUE
$639,900
$481,000
33.04
$675,000
03-May-2022
1993
24-May-2022
1,015
$630
25 13528 96 AVENUE
$852,000
$716,000
18.99
$849,990
16-May-2022
2006
24-May-2022
1,528
$557
Renovated/updated.
60 15151 34 AVENUE
$1,045,000
$862,000
21.23
$1,050,000
16-May-2022
2006
24-May-2022
2,118
$493
27 2687 158 STREET
$1,250,000
$1,030,000
21.36
$1,350,000
04-May-2022
2013
24-May-2022
2,252
$555
24 6140 192 STREET
$623,000
$572,000
8.92
$639,000
16-May-2022
1988
25-May-2022
1,471
$423
Renovated/updated.
12 15068 58 AVENUE
$780,000
$660,000
18.18
$775,000
17-May-2022
2000
25-May-2022
1,398
$557
15 6238 192 STREET
$835,000
$623,000
34.03
$899,900
19-Apr-2022
2007
25-May-2022
1,402
$595
101 2280 163 STREET
$1,100,000
$986,000
11.56
$999,900
16-May-2022
2016
26-May-2022
1,937
$567
Renovated/updated.
19 2780 150 STREET
$1,075,000
$898,000
19.71
$999,000
25-May-2022
1999
27-May-2022
1,440
$746
106 9781 148A STREET
$755,000
$665,000
13.53
$749,900
24-May-2022
1986
28-May-2022
1,377
$548
Renovated/updated.
15923 ALDER PLACE
$752,000
$705,900
6.53
$799,800
16-May-2022
1974
30-May-2022
2,088
$360
58 17710 60 AVENUE
$450,000
$346,900
29.72
$429,900
25-May-2022
1973
31-May-2022
971
$463
Port Moody
Address
Sold Price
Assessed
% Δ
True List Price
True List Date
Year Built
Sold Date
Sqft
Price per sqft
Notes
90 55 HAWTHORN DRIVE
$1,421,000
$1,168,000
21.66
$1,499,000
04-Apr-2022
2007
08-May-2022
2,003
$709
11 50 HETT CREEK DRIVE
$1,104,000
$920,000
20.00
$1,125,000
04-May-2022
1998
10-May-2022
1,674
$659
1926 HIGHVIEW PLACE
$654,000
$648,900
0.79
$745,000
22-Mar-2022
1969
11-May-2022
1,860
$351
40 795 NOONS CREEK DRIVE
$1,336,500
$1,073,000
24.56
$519,000
28-Sep-2011
1990
14-May-2022
2,395
$558
146 2000 PANORAMA DRIVE
$1,049,000
$840,000
24.88
$1,199,000
04-Apr-2022
2003
15-May-2022
1,343
$781
13 795 NOONS CREEK DRIVE
$1,230,000
$988,000
24.49
$1,199,000
09-May-2022
1990
18-May-2022
2,042
$602
112 3382 VIEWMOUNT DRIVE
$998,000
$845,000
18.11
$1,099,000
02-May-2022
2012
23-May-2022
1,149
$868
1081 CECILE DRIVE
$808,000
$763,600
5.81
$799,800
16-May-2022
1969
24-May-2022
1,660
$486
Coquitlam
Address
Sold Price
Assessed
% Δ
True List Price
True List Date
Year Built
Sold Date
Sqft
Price per sqft
Notes
18 1338 HAMES CRESCENT
$1,003,000
$851,000
17.86
$1,048,000
19-Apr-2022
2012
08-May-2022
1,300
$771
122 217 BEGIN STREET
$699,900
$590,000
18.63
$725,000
18-Apr-2022
1993
08-May-2022
1,154
$606
11 3470 HIGHLAND DRIVE
$1,100,000
$928,000
18.53
$1,088,000
25-Apr-2022
2014
09-May-2022
1,522
$722
5 1406 BRUNETTE AVENUE
$741,000
$604,800
22.52
$658,000
02-May-2022
1987
09-May-2022
1,215
$609
Renovated/updated.
102 801 RODERICK AVENUE
$1,199,000
$964,000
24.38
$1,099,000
04-May-2022
2015
10-May-2022
1,579
$759
132 3105 DAYANEE SPRINGS BOULEVARD
$999,999
$866,000
15.47
$999,900
03-May-2022
2009
10-May-2022
1,497
$668
302 SCHOOLHOUSE STREET
$730,000
$534,200
36.65
$699,000
02-May-2022
1986
10-May-2022
1,079
$676
Renovated/updated.
6 1190 FALCON DRIVE
$808,000
$798,000
1.25
$859,000
02-May-2022
1988
12-May-2022
2,284
$353
103 1331 HACHEY AVENUE
$1,102,000
$985,000
11.88
$999,000
03-May-2022
2017
12-May-2022
1,522
$724
123 548 FOSTER AVENUE
$1,150,000
$980,000
17.35
$998,000
19-Apr-2022
2015
13-May-2022
1,237
$929
Renovated/updated.
4 1216 JOHNSON STREET
$1,100,000
$906,000
21.41
$998,000
08-May-2022
1990
16-May-2022
2,042
$538
26 1125 KENSAL PLACE
$1,450,000
$1,172,000
23.72
$1,498,000
11-May-2022
2010
16-May-2022
2,038
$711
43 2736 ATLIN PLACE
$840,000
$729,500
15.15
$838,888
11-May-2022
1987
16-May-2022
1,315
$638
79 1320 RILEY STREET
$999,000
$871,000
14.70
$999,000
11-May-2022
2013
17-May-2022
1,325
$753
5A 501 COCHRANE AVENUE
$727,500
$699,000
4.08
$748,800
09-May-2022
1990
17-May-2022
1,371
$530
46 98 BEGIN STREET
$815,000
$662,500
23.02
$699,000
09-May-2022
1988
17-May-2022
1,375
$592
7 2880 DACRE AVENUE
$890,000
$707,500
25.80
$839,000
09-May-2022
1976
17-May-2022
1,490
$597
107 1331 HACHEY AVENUE
$1,200,000
$1,048,000
14.50
$1,149,900
11-May-2022
2017
18-May-2022
1,629
$736
23 1299 COAST MERIDIAN ROAD
$1,188,800
$1,030,000
15.42
$1,288,000
19-Apr-2022
2011
22-May-2022
2,021
$588
33 1486 JOHNSON STREET
$1,231,000
$947,000
29.99
$1,100,000
19-May-2022
1998
24-May-2022
1,879
$655
4 3395 GALLOWAY AVENUE
$960,000
$833,000
15.25
$999,900
20-Apr-2022
2012
25-May-2022
1,378
$696
13 1328 BRUNETTE AVENUE
$786,500
$684,000
14.99
$689,900
24-May-2022
1988
30-May-2022
1,446
$543
Port Coquitlam
Address
Sold Price
Assessed
% Δ
True List Price
True List Date
Year Built
Sold Date
Sqft
Price per sqft
Notes
74 2615 FORTRESS DRIVE
$1,211,500
$971,000
24.77
$1,223,000
02-May-2022
1993
09-May-2022
2,466
$491
34 2381 ARGUE STREET
$1,320,000
$1,124,000
17.44
$1,248,000
10-Apr-2022
2003
11-May-2022
2,551
$517
77 678 CITADEL DRIVE
$1,210,000
$956,000
26.57
$1,248,800
03-May-2022
2000
13-May-2022
2,647
$457
5 3140 WELLINGTON STREET
$1,050,000
$809,000
29.79
$899,990
20-Apr-2022
1993
14-May-2022
1,704
$616
61 2380 RANGER LANE
$989,000
$864,000
14.47
$989,000
26-Apr-2022
2016
15-May-2022
1,442
$685
102F 3655 SHAUGHNESSY STREET
$830,000
$698,800
18.78
$880,000
03-May-2022
1982
16-May-2022
1,449
$572
104E 3655 SHAUGHNESSY STREET
$920,000
$699,000
31.62
$950,000
26-Apr-2022
1982
16-May-2022
1,482
$620
14 2332 RANGER LANE
$910,000
$741,000
22.81
$925,000
10-May-2022
2012
17-May-2022
1,231
$739
2 2495 DAVIES AVENUE
$830,000
$734,000
13.08
$880,000
10-May-2022
2008
18-May-2022
1,328
$625
14 2371 RANGER LANE
$1,230,000
$1,020,000
20.59
$1,299,000
02-May-2022
2017
20-May-2022
1,769
$695
77 1055 RIVERWOOD GATE
$825,000
$706,000
16.86
$825,000
16-May-2022
2002
22-May-2022
1,178
$700
32 1207 CONFEDERATION DRIVE
$895,000
$854,000
4.80
$849,900
13-May-2022
1991
22-May-2022
1,480
$604
42 2358 RANGER LANE
$985,000
$833,000
18.25
$1,049,900
10-May-2022
2015
23-May-2022
1,296
$760
1 920 CITADEL DRIVE
$1,000,000
$782,000
27.88
$900,000
18-May-2022
1989
24-May-2022
2,190
$456
25 920 CITADEL DRIVE
$1,000,000
$767,000
30.38
$960,000
26-May-2022
1989
30-May-2022
2,171
$460
110 750 PRAIRIE AVENUE
$810,000
$690,000
17.39
$799,000
25-May-2022
1989
31-May-2022
1,511
$536
Pitt Meadows
Address
Sold Price
Assessed
% Δ
True List Price
True List Date
Year Built
Sold Date
Sqft
Price per sqft
Notes
19 12188 HARRIS ROAD
$760,000
$566,000
34.28
$769,000
26-Apr-2022
1992
10-May-2022
1,275
$596
9 19034 MCMYN ROAD
$730,000
$659,000
10.77
$720,000
02-May-2022
1994
11-May-2022
1,414
$516
76 19572 FRASER WAY
$785,000
$724,000
8.43
$889,000
02-May-2022
2007
17-May-2022
1,390
$564
9 10995 BARNSTON VIEW ROAD
$875,000
$652,000
34.20
$848,888
16-May-2022
2013
19-May-2022
1,300
$673
Langley
Address
Sold Price
Assessed
% Δ
True List Price
True List Date
Year Built
Sold Date
Sqft
Price per sqft
Notes
99 7179 201 STREET
$775,000
$627,000
23.60
$799,000
28-Mar-2022
2004
08-May-2022
1,234
$628
1 22128 48A AVENUE
$1,090,000
$940,000
15.96
$789,990
29-Sep-2020
2019
08-May-2022
1,820
$598
Renovated/updated.
50 7169 208A STREET
$1,190,000
$961,000
23.83
$1,360,000
31-Mar-2022
2018
08-May-2022
2,362
$503
68 20738 84 AVENUE
$1,000,000
$912,000
9.65
$979,000
02-May-2022
2011
09-May-2022
2,124
$470
36 8930 WALNUT GROVE DRIVE
$852,000
$694,000
22.77
$799,900
03-May-2022
1995
09-May-2022
1,618
$526
Renovated/updated.
164 20391 96 AVENUE
$850,000
$648,000
31.17
$848,800
05-May-2022
1992
10-May-2022
1,529
$555
12 20498 82 AVENUE
$990,000
$770,000
28.57
$999,900
02-May-2022
2018
10-May-2022
1,443
$686
Renovated/updated.
24 20761 TELEGRAPH TRAIL
$815,000
$770,000
5.84
$938,500
05-Apr-2022
1994
10-May-2022
1,942
$419
46 8161 201 STREET
$999,000
$739,000
35.18
$1,088,000
31-Mar-2022
2020
10-May-2022
1,367
$730
Renovated/updated.
3 8050 204 STREET
$950,000
$794,000
19.65
$959,900
19-Apr-2022
2018
10-May-2022
1,465
$648
160 8138 204 STREET
$990,000
$771,000
28.40
$998,000
09-May-2022
2016
10-May-2022
1,481
$668
Renovated/updated.
20 8968 208 STREET
$881,000
$732,000
20.36
$979,000
30-Mar-2022
2002
10-May-2022
1,695
$519
55 8570 204 STREET
$925,000
$735,000
25.85
$888,800
04-May-2022
2016
11-May-2022
1,309
$706
60 8555 209 STREET
$1,225,000
$964,000
27.07
$999,000
04-May-2022
1995
11-May-2022
1,597
$767
Renovated/updated.
3 8371 202B STREET
$1,068,000
$807,000
32.34
$1,234,000
18-Apr-2022
2019
11-May-2022
1,731
$616
83 20038 70 AVENUE
$910,000
$740,000
22.97
$989,900
05-Apr-2022
2007
13-May-2022
1,614
$563
47 7947 209 STREET
$1,025,000
$793,000
29.26
$1,180,000
26-Apr-2022
2019
13-May-2022
1,647
$622
Renovated/updated.
16 21704 96 AVENUE
$1,170,000
$984,000
18.90
$1,149,000
11-May-2022
2010
13-May-2022
2,363
$495
35 8508 204 STREET
$1,223,000
$879,000
39.14
$1,248,000
10-May-2022
2017
14-May-2022
1,818
$672
Renovated/updated.
25 7811 209 STREET
$795,000
$642,000
23.83
$798,000
29-Mar-2022
2015
14-May-2022
1,147
$693
127 7947 209 STREET
$930,000
$735,000
26.53
$986,000
13-Apr-2022
2019
14-May-2022
1,517
$613
26 8892 208 STREET
$735,000
$593,000
23.95
$799,800
04-Apr-2022
1994
15-May-2022
1,668
$440
150 8138 204 STREET
$875,000
$747,000
17.14
$884,900
10-May-2022
2016
15-May-2022
1,350
$648
15 22334 48 AVENUE
$920,000
$699,000
31.62
$999,000
05-May-2022
2021
17-May-2022
1,557
$590
18 22334 48 AVENUE
$885,000
$699,000
26.61
$899,000
11-May-2022
2021
17-May-2022
1,378
$642
66 8716 WALNUT GROVE DRIVE
$900,000
$744,000
20.97
$945,000
16-May-2022
1991
17-May-2022
1,574
$571
73 8892 208 STREET
$755,900
$593,000
27.47
$755,900
10-May-2022
1994
19-May-2022
1,638
$461
164 9012 WALNUT GROVE DRIVE
$865,000
$895,000
-3.35
$985,000
28-Mar-2022
1992
19-May-2022
1,838
$470
56 20761 DUNCAN WAY
$835,000
$688,000
21.37
$865,000
25-Apr-2022
2004
19-May-2022
1,540
$542
Renovated/updated.
29 20852 77A AVENUE
$880,000
$785,000
12.10
$989,000
26-Apr-2022
2015
20-May-2022
1,464
$601
18 7665 209 STREET
$975,000
$777,000
25.48
$1,059,000
28-Apr-2022
2016
21-May-2022
1,497
$651
243 20391 96 AVENUE
$805,000
$734,000
9.67
$899,500
14-Mar-2022
1992
23-May-2022
1,761
$457
Renovated/updated.
96 7947 209 STREET
$990,000
$846,000
17.02
$1,099,000
26-Apr-2022
2019
24-May-2022
1,897
$521
119 20738 84 AVENUE
$1,055,000
$881,000
19.75
$1,150,000
05-May-2022
2011
24-May-2022
2,145
$491
Renovated/updated.
43 7138 210 STREET
$1,445,000
$998,000
44.79
$1,538,000
27-Feb-2022
2017
27-May-2022
2,874
$502
Maple Ridge
Address
Sold Price
Assessed
% Δ
True List Price
True List Date
Year Built
Sold Date
Sqft
Price per sqft
Notes
34 11588 232 STREET
$730,000
$507,000
43.98
$699,000
02-May-2022
1992
09-May-2022
1,115
$654
Renovated/updated.
6 10151 240 STREET
$695,000
$564,000
23.23
$699,880
21-Apr-2022
2014
09-May-2022
1,088
$638
76 24108 104 AVENUE
$899,000
$807,000
11.40
$899,000
03-May-2022
2018
09-May-2022
1,796
$500
18 21491 DEWDNEY TRUNK ROAD
$714,000
$569,000
25.48
$649,900
03-May-2022
1990
10-May-2022
1,478
$483
Renovated/updated.
9 11860 210 STREET
$840,000
$663,000
26.70
$799,900
11-May-2022
1998
13-May-2022
1,334
$629
Renovated/updated.
14 11305 240 STREET
$850,000
$696,000
22.13
$899,000
02-May-2022
2015
15-May-2022
1,433
$593
23 11305 240 STREET
$865,000
$727,000
18.98
$919,900
27-Apr-2022
2015
16-May-2022
1,483
$583
11665 FULTON STREET
$634,900
$514,000
23.52
?
29-Apr-2014
1968
16-May-2022
1,250
$507
28 22900 126 AVENUE
$720,000
$624,000
15.38
$785,000
20-Apr-2022
1991
17-May-2022
1,353
$532
Renovated/updated.
12 13263 236 STREET
$1,048,000
$887,000
18.15
$1,048,000
18-May-2022
2021
20-May-2022
2,157
$485
28 21960 RIVER ROAD
$737,000
$576,000
27.95
$479,900
13-Jun-2018
1993
21-May-2022
1,148
$641
Renovated/updated.
503 11726 225 STREET
$560,000
$449,300
24.64
$559,000
04-May-2022
1989
22-May-2022
1,207
$463
18 12296 224 STREET
$505,500
$369,000
36.99
$479,000
26-May-2022
1988
27-May-2022
968
$522
White Rock
Address
Sold Price
Assessed
% Δ
True List Price
True List Date
Year Built
Sold Date
Sqft
Price per sqft
Notes
4 14985 VICTORIA AVENUE
$1,140,000
$915,100
24.58
$1,099,000
12-May-2022
1980
16-May-2022
1,875
$608
14013 MARINE DRIVE
$920,000
$683,000
34.70
$920,000
18-May-2022
1972
22-May-2022
1,955
$470